DATA
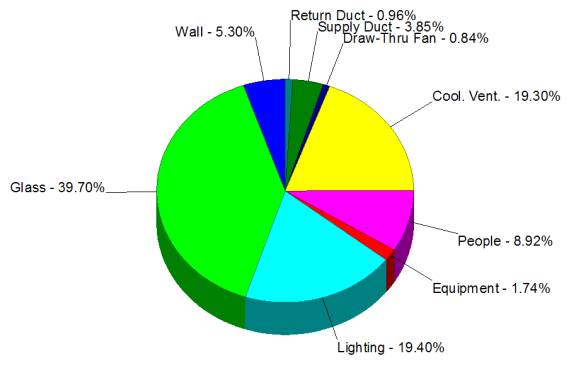
Thermal Load Calculations: In order to verify the optimum operating capacities of the given space a thermal load computer modeling program CHVAC, developed by Elite Software was used. This program required the information on all of the components of the space which contribute to the heating, or loss of heat of the space. This program produces a thorough report, below is an examples of the pie charts that can be used for finding potential improvements.
Cooling Requirements:
Figure 1: Area Net Energy Gain for August at 5 PM
Heating Requirements:
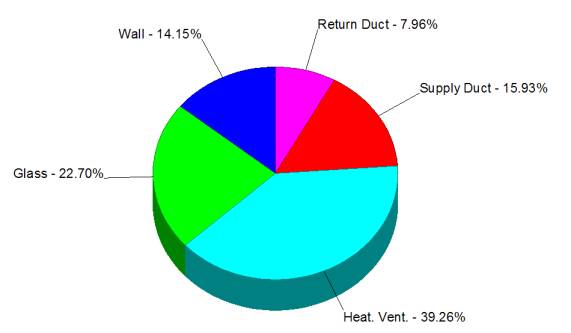
Figure 2: Area energy loss for August at 5 PM
Another useful feature provided in the report is a hour-by-hour analysis for the heat contributing factors for the space.
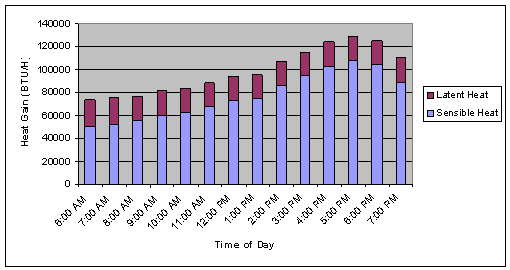
Figure 3: August heat gain for working hours.
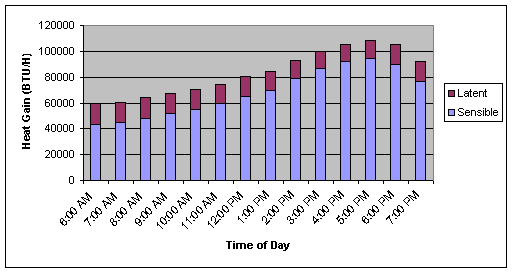
Figure 4: October heat gain for working hours
Existing Conditions: The performance of the system was analyzed by taking several measurements throughout the space. The intent of these measurements were to determine the various enthalpies of the air at different stages through the heating and cooling cycle.
The Data collected concluded that the electric heat strips in the various zone control dampers were running when the outdoor conditions suggest that there was no need for this. The graph below shows that the exiting temperature for two control boxes, from two different zones in the area covered by this project. The high temperature is indicative of the heat strips being on.
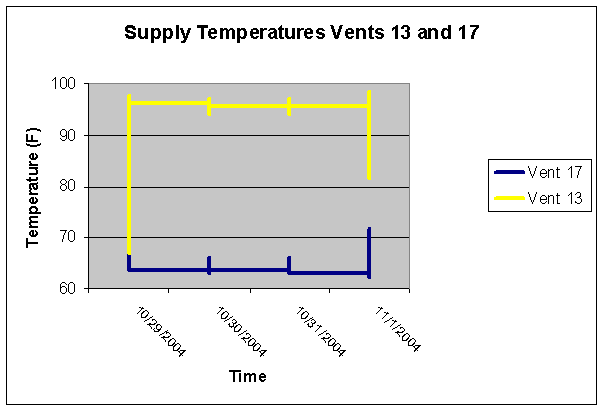
Figure 5: Temperature measurements to show the "heater running" time.
Vent 13 corresponded with Heater 2, Vent 17 was with Heater 3 and was typical of Heater 1 and Heater 4. Heater number 2 was running at 80 % when the other heaters were only running at 20%. This data was very helpful in pinpointing the set points as a problem in the system.
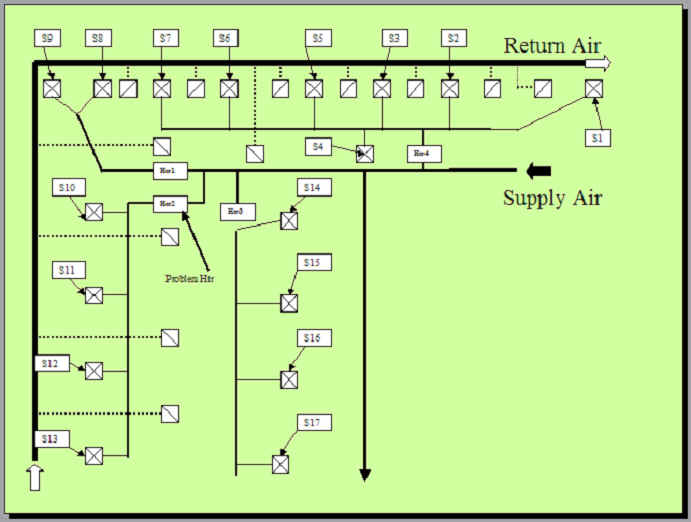
Figure 6: System 3 Diagram corresponds with graph shown in figure 5.