

|
CATALYTIC TEMPERATURE SENSOR |
|
CUMMINS II |

|
The purpose of the first set of tests was to determine if entire system was set up and performing properly. For these tests, the system was heated from ambient temperature to steady state with the heat guns at their lowest temperature setting. Once this was achieved the guns were set to their hottest setting, and testing continued until steady state was reached again. This showed how quickly the system heated up and the difference in temperature experience by elements with the various heat gun settings.
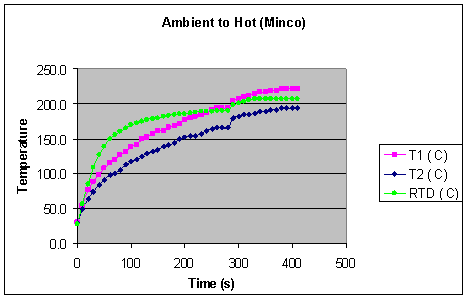
The RTDs were located directly between the two thermocouples, so their temperature was expected to remain between that of the thermocouples throughout most tests. However this was usually only the case when the system reached steady state. From figure 8.1, it is seen that the RTD had a much faster response than either of the thermocouples. The thermocouple closest to the heat source (T1) consistently remained at a higher temperature than the thermocouple further away (T2). They were to be used as references to compare the temperatures of the RTDs.
Figure 8.1
Since the response of the RTD was clearly faster than that of the testing system and the thermocouples, they could not be used to test the response of the RTDs. In the next set of tests this was done by subjecting the RTDs to various step responses.
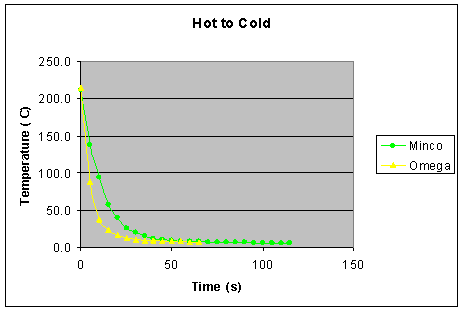
First the RTDs were heated to the maximum system temperature and immediately submerged into a cup of ice water. The results are shown in figure 8.2, and it can be seen that one RTD changed temperature faster than the other. From this graph time constants were determined for each of the elements by finding how long it took the temperature to change to 63.2% of its final value. Once that temperature was determined, interpolation between the two closest temperatures was used to find the time constants. This method is also used for finding all other time constants in this report. The time constants for this test were 11.4 seconds for the Minco RTD and 5.4 for Omega. In a test were the temperature drops this much and the element is submersed in water, it is expected the time constants would be very low. These results should be used to compare the two elements to each other and not to simulate exhaust conditions.
Figure 8.2
In the next test, after the RTDs were fully cooled, they were immediately placed back into the fully heated system to see how quickly they could measure the temperature. This process took much longer than the cooling process, with a time constant of 27.9 for Minco and 26.9 for Omega.
Figure 8.3
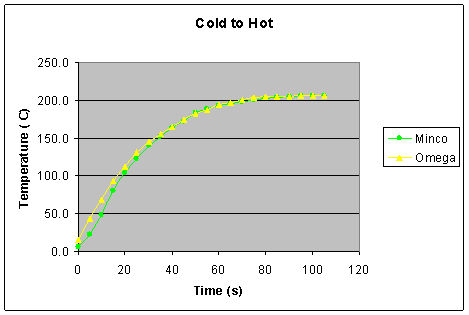
The next set of tests were also used to establish the RTDs response to heating and cooling, however it needed to be done over a smaller range of temperatures. In order to create step responses over smaller temperature ranges, testing was done by removing the RTDs from the fully heated system for a set amount of time, and then reinserting them into the test system. This allows for analysis of the time required for the RTD to heat up from several different temperatures, temperatures that could not be reached with the current test set up.
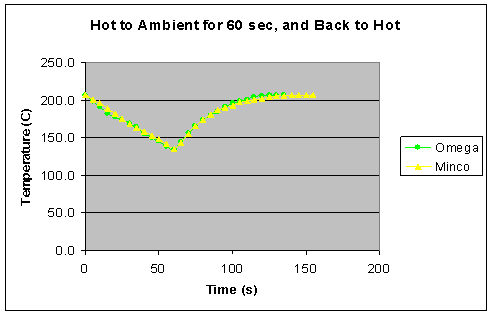
Figure 8.4 shows a test where this is done for 60 s, allowing a step response to be imposed on the RTD from 135 to 207 degrees C. Time constants for this were 24.6 for Omega and 25.1 for Minco.
Figure 8.4
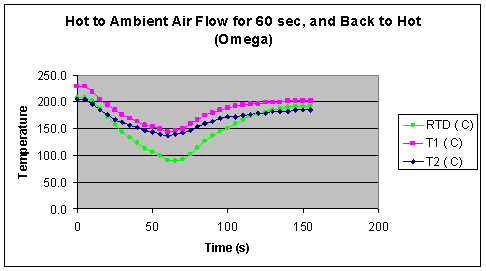
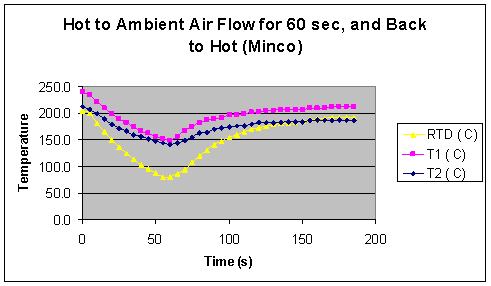
The final tests were designed to compare the responses of the RTDs as their environment changes from hot air flow to cooler air flow and vice versa. This is very similar to the environment the RTD is intended for; a vehicle exhaust. Figure 8.4 and 8.5 show this for the Omega and Minco RTDs. Specific time constants were not able to be determined from these tests because the system does not heat up instantly, however they show how each RTD would react in a pipe while the moving air changes velocity.
Figure 8.4
Figure 8.5
|
|
RESULTS & ANALYSIS |