![]() (1)
(1)
Determination of Aerodynamic Forces
|
|
|
|
|
|
|
|
|
|
The objective of this experiment is to determine the aerodynamic lift and drag forces, Fl and Fd, respectively, experienced by a circular cylinder placed in a uniform free-stream velocity, U¥. Two different methods will be used to determine these forces.
The total drag on any body consists of skin friction drag and form drag.
The former arises due to the viscous forces acting on the body while the
latter is due to the unbalanced pressure forces on the body. The sum of
the two is called total or profile drag. There are several methods that
can be used to determine the drag forces. These are discussed in detail
below.
Prediction of Drag from Wake Measurements
From the measured velocity profiles in the wake, the drag can be determined by means of the law of conservation of linear momentum, providing the flow is steady. With reference to Figure 1, a control surface around the body is selected as shown. The cross section II in which measurements will be taken is located behind the body at a short distance; the static pressure at this station is different from the free-stream pressure, p¥. Hence, there will be therefore a net contribution to the momentum balance due to this pressure difference. In order to account for and minimize this effect another section, Section I (an imaginary section), is chosen far behind the body such that the pressure is equal to the free-stream pressure. Therefore, the pressure forces acting on this newly-defined control surface will be canceled. The general conservation law can be written, without considering the effects contributed by pressure, as:
![]() (1)
(1)
where W is the width of the body and u1 denotes the velocity profile in the wake measured at Section I. Unfortunately, the flow cannot achieve the required relation p1 = p¥unless the measuring station is placed very far downstream, usually more than 100 diameters, from the cylinder. It is therefore not realistic to take measurement at section I. Nevertheless, it is possible to establish relation between the flow quantities measured at section I and those measured at section II which is located close to the cylinder. The procedure is described as follows:
ru1dy1 = ru2dy2 (2)

Figure 1. Detremination
of profile drag.
In order to find the relation between Fd and the velocity profile at the designated measuring station II, we apply the equation of continuity along a stream tube.
Hence,
Furthermore, we make the assumption that the flow moves from Section II to I without pressure losses, i.e., the total pressure remains constant along each streamline between I and II:
p1+ 1/2 ru12 = p2+1/2 ru22 (4)
Introducing the total pressure as
Pt=p+1/2 ru2 (5)
We can rewrite Equation 3 by using Equations 4 and 5. Hence, we have:
![]() (6)
(6)
where the integral extends over cross-section II.
Introducing a dimensionless drag coefficient, CD, as follows :
where Wd is the reference area of the body, we can rewrite Equation 6 as follows:(7)
 (8)
(8)where
Measurement of the Normal Pressure distribution on the body
When the Reynolds number is sufficiently large, Re > 103, the skin friction drag of a bluff body is relatively negligible compared to its form drag. Then the measurement of the drag forces due to normal pressures around the body will be a good approximation to the total drag.
For a cylinder, the body lift and drag per unit length due to normal pressure only are given by
FL=ò (p- p¥)dx (10)
FD=ò(p-p¥)dy (11)
where the integrations are taken around the contour of the cylinder. A cylindrical coordinate will be used instead, and we can rewrite Equation 11 as:
 (12)
(12)Similarly, the lift force can be estimated to be:
 (13)
(13)
The following components will be used:
1. Wind Tunnel.
2. Pitot static tube.
3. A cylindrical test section with circumferential pressure ports.
4. Scanivalve and scanivalve digital interface unit.
5. ADC Card on a Pentium-based PC.
6. Computer-operated vertical drive.
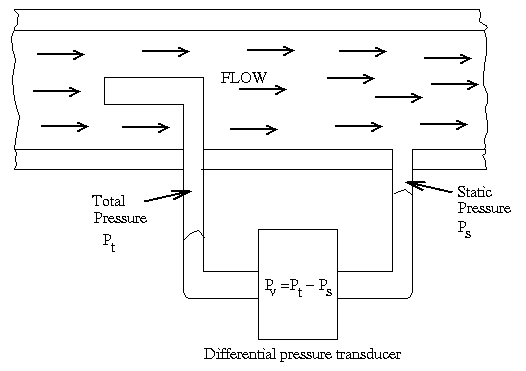
A pitot tube can be used in the wind tunnel to measure the velocity of the tunnel. The assumption we have to make is that the static pressure is constant everywhere in a uniform free-stream inside the wind tunnel. It is a reasonable assumption considering that there is no pressure loss, therefore, no pressure gradient, in the system. However, the situation will be totally different for measurement taken inside a wake behind a bluff body, that is, a significant amount of pressure variation exists across the wake profile. In order to accurately determine the velocity profile in the wake, a pitot- static tube should be used. The pitot-static tube is a combination of the static tube and the pitot tube, see Figure 2. Let us assume that the tube is properly aligned with the flow direction. Assuming steady one-dimensional flow of an incompressible inviscid fluid, we can derive the following result,
 (14)
(14)
where V is flow velocity, p is the density of the fluid, pstag is the stagnation pressure of the free-stream and pstag is the static pressure.

Figure 2. Pitot-static tube configuration
It is usually more difficult to accurately measure the static pressure. The difference between the true pstag and measured pstag may be due to one or all of the following:

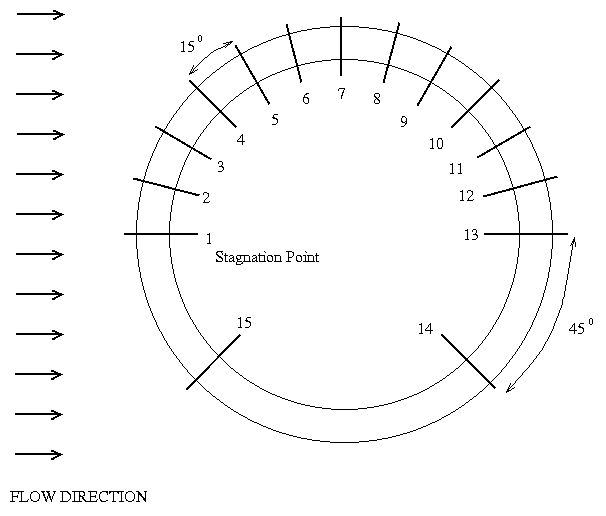
Figure 3. Pressure port arrangement
WARNING: Start the wind tunnel at a counter setting of 100 to 200 only. Do not start it at higher counter settings
1. Wake Measurement:
For the wake measurement, select two downstream locations, x/D = 5 and x/D=10 for the measuring section II. Set the wind tunnel speed counter at 550.
2. Normal Pressure distribution:
Two different Reynolds numbers shall be used for this part of the experiment. Wind tunnel speed counter settings of 550 and 350 will be used to obtain the two different Reynolds number.
Present all of your data in a dimensionless form, that is, use CD and CL, instead of drag and lift forces respectively. Also indicate the Reynolds number of the flow when presenting the values for CD and CL.
- Plot the non-dimensional vertical distance versus the non-dimensional velocity at the locations x/D=5 and x/D=10. Use D and U¥ as the non-dimensionalizing parameters. Discuss the wake profiles obtained at the two locations.
- Calculate CD from the wake profiles, compare to values obtained from Fig. 4. Discuss reasons for discrepancies, if any.
- Plot the variation of Cp as a function of the angular location and compare it to the theoretical profile for the cylinder in an inviscid flow (Refer to any Fluid Mechanics book). Explain the difference.
- Calculate the values of CD and CL from surface pressure measurements? Compare CD values to those obtained from Figure 4.
- Compare the results obtained by the two different measuring methods and discuss reasons for any differences. Which method is more accurate ?
- Does the pitot-static tube read steady inside the wake? How about, outside the wake? Can pitot-static tubes measure turbulent fluctuations? Why?

Figure 4. Drag coefficient of a circular cylinder

Experiment 4 Data Sheet
(Click here to Download Experiment 4 Data Sheet)
Determination of Aerodynamic Forces
Note: Please note the units of the quantities which are being measured, when recording data. For example, when measuring voltage, if the voltmeter reads 16 mV, then write down 16 mV instead of just 16.
1. Double-click on the LabVIEW icon to start the program.
2. Double click on
the eml4304l folder, and select Exp4trucontrol.vi. Double
click on it to start the virtual
instrument.
Notes on the Virtual Instrument:
The Exp4trucontrol.vi VI is an expansion of the oscilloscope.vi used by you in Experiment 3. The main modifications in this program are :
a). Velmex Control: This controls the movement of the pitot-static probe in the vertical direction.
b). Scanivalve Control: This controls the scanivalve port setting remotely. This has four selections:
d). The Output Center gives the output of the VI in two different forms:
You can record either value. If you record the ADC output, you will need
to use the above equation to
obtain the pressure values.
e). Unlike the other
labs, the data will not be written to file (since it is difficult
to tag the data vis-a-vis the
pitot probe position and the scanivalve position, while keeping the program
fool-proof). You need to
record the data, obtained in Step d above, in your lab book.
I. Prediction of Drag from Wake Measurement
Case A: Probe
at x/D = 5
Velocity = 30.68
m/s (Counter 550). pt![]() -
p
-
p![]() =
= ![]() _________
_________
|
|
|
(D/A #) |
(D/A #) |
|
|
|
|
|
|
|
|
|
|
|
|
|
|
|
|
|
|
|
|
|
|
|
|
|
|
|
|
|
|
|
|
|
|
|
|
|
|
|
|
|
|
|
|
|
|
|
|
|
|
|
|
|
|
|
|
|
|
|
|
|
|
|
|
|
|
|
|
|
|
|
|
|
|
|
|
|
|
|
|
|
|
|
|
|
|
|
|
|
|
|
|
|
|
|
|
|
|
|
|
|
|
|
|
|
|
|
|
|
|
|
|
|
|
|
|
|
|
|
|
|
|
|
|
|
|
|
|
|
|
Case B: Probe at x/D = 10
Velocity = 30.68 m/s (Counter 550). pt![]() - p
- p![]() =_________
=_________
|
|
|
(D/A #) |
(D/A #) |
|
|
|
|
|
|
|
|
|
|
|
|
|
|
|
|
|
|
|
|
|
|
|
|
|
|
|
|
|
|
|
|
|
|
|
|
|
|
|
|
|
|
|
|
|
|
|
|
|
|
|
|
|
|
|
|
|
|
|
|
|
|
|
|
|
|
|
|
|
|
|
|
|
|
|
|
|
|
|
|
|
|
|
|
|
|
|
|
|
|
|
|
|
|
|
|
|
|
|
|
|
|
|
|
|
|
|
|
|
|
|
|
|
|
|
|
|
|
|
|
|
|
|
|
|
|
|
|
|
|
II. Normal
Pressure Distribution
|
|
|
|
|
Number |
V = 17.83 m/s (SCR=350) |
V = 30.68 m/s (SCR=550) |
|
|
|
|
|
|
|
|
|
|
|
|
|
|
|
|
|
|
|
|
|
|
|
|
|
|
|
|
|
|
|
|
|
|
|
|
|
|
|
|
|
|
|
|
|
|
|
|
|
|
|
|
|
|
|
|
|
|
|
|
Scanivalve operation:
|
|
|
|
|
|
|
|
|
|
|
|
Pressure Tap Selector (Reference Pressure):
|
|
|
|
|
|
|
|
|
Cylinder Geometry:
Diameter:
3 cm; Length: 30 cm.
YOU NEED TO GET THE LAB INSTRUCTOR'S SIGNATURE BEFORE LEAVING.
The student has performed the experiment satisfactorily and has cleaned the work area.
___________________________ _______________
(Lab assistant's signature) Date