Fast Fourier Transform
When sound waves are
viewed on an oscilloscope via microphone, there is a visual combination of
waves with different frequencies. This will appear as a baseline wave with
specific amplitude and higher frequency waves riding on top of it. In order to analyze the different frequency
contributions in a particular wave, a different method of analysis must be
implemented. The decomposition of a signal into a combination of sinusoids is
known as a Fourier transform. This representation contains a summation of waves
with different frequencies and amplitudes and is equivalent to the original
function. In order for a computer to decompose a signal into its Fourier
components, it has to take discrete data points and use an algorithm to
determine the magnitude contribution of each frequency component of the signal.
The process of obtaining the Discrete Fourier transform through use of
algorithms is known as a Fast Fourier Transform (FFT). Once these components
are analyzed, a plot of amplitude versus frequency is created to visualize the
relative contributions of each frequency to the signal. An example of a Fourier
transform is shown below. The major frequency of the low ‘A’ occurs at 220 Hz,
but it also contains components at 440 Hz and 660 Hz, which are integer
multiples of the fundamental frequency (Sequential values of n in the guitar
analysis).
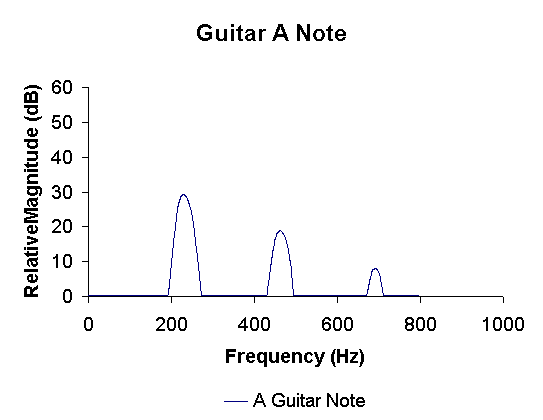
Figure
1: The FFT of a low
'A' played on guitar.
This fundamental
frequency is the first mode of the note, which is the lowest frequency that
produces a sinusoidal wave for a specific length of the guitar string. The other
two modes are designated by the second and third frequency components, each
having a lower magnitude contribution than the previous.