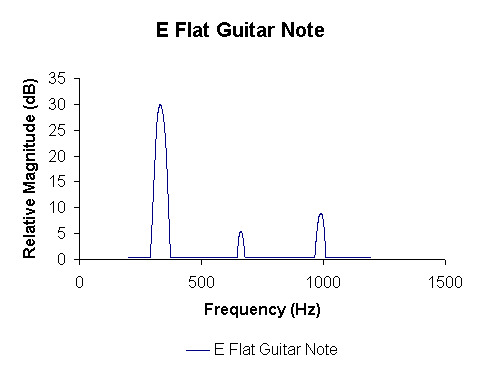
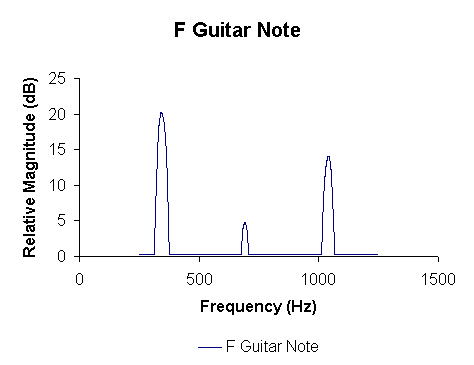
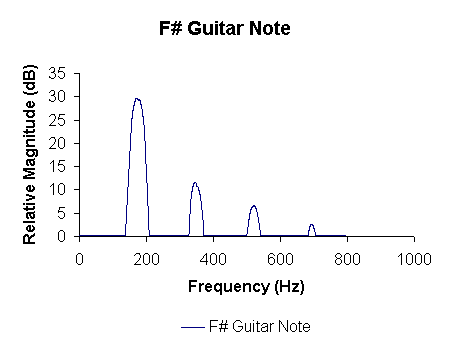
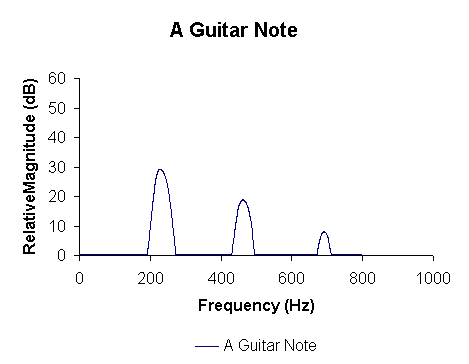
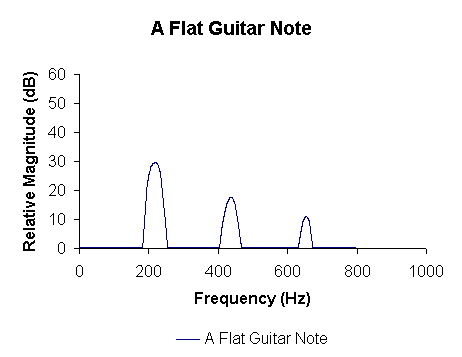
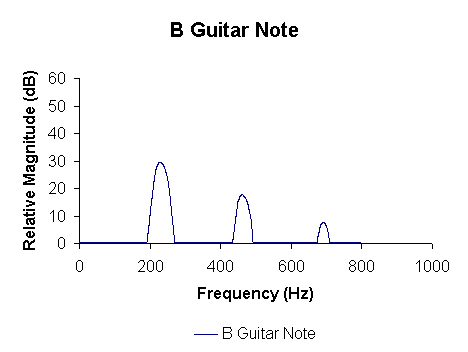
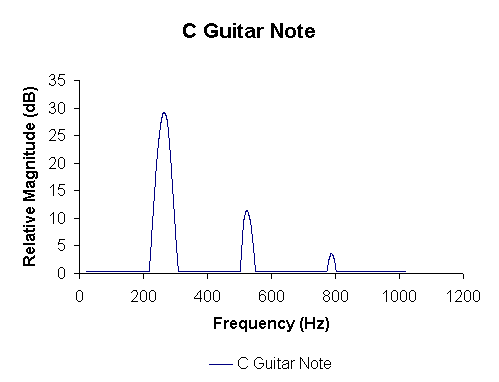
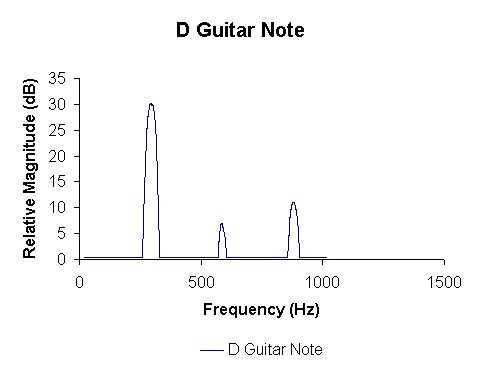
Guitar Experimental Analysis
For the guitar analysis,
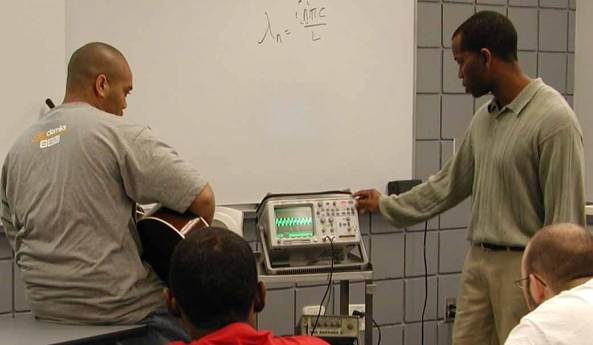
the correspondence of the string model was tested to the physical instrument. A
microphone and scope were set up to record and display the FFT of the guitar
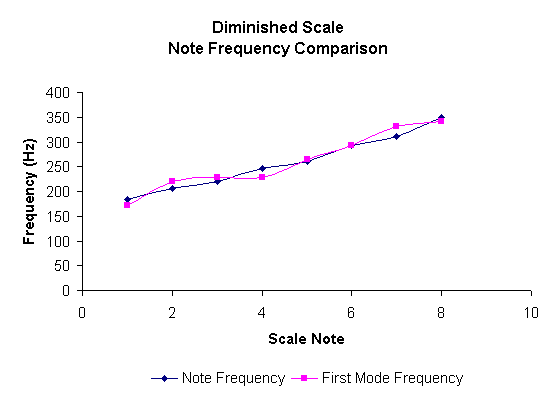
sound. The guitar string was tuned to a known musical note and a diminished
scale was played starting with E flat. Each of the note’s Fourier transforms
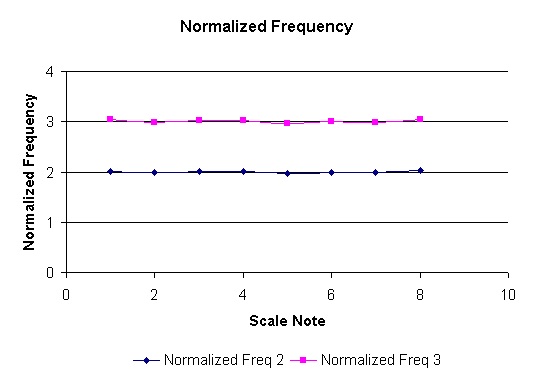
were recorded and are shown below. The data and model correlated well as the
first three modes dominated the signal. The following graphs also show the
correspondence of the frequency peaks where the second and third peaks were
twice and three times the first respectively.