Jet Flow Field
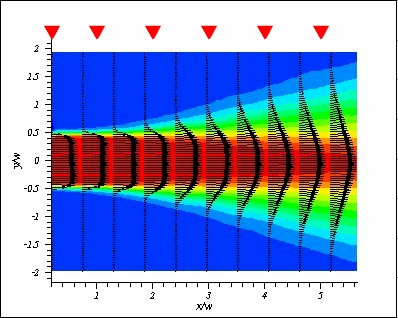
The following is a typical jet velocity field distribution measured using the PIV. A total of 190 instantaneous PIV velocity fields are ensemble-averaged in order to obtain this time-averaged flow field. The time-averaged jet velocity at the exit of the nozzle is a uniform, top-hat profile. Due to the large velocity difference between the jet and the ambient fluid, a thin shear layer is created and it is highly unstable. The shear layer is subjected to flow instabilities that eventually lead to the generation of strong turbulent fluctuations and the shear layer continuously grows downstream. This highly turbulent shear flow entrains ambient fluid into the jet and enhances the flow mixing. Consequently, the shear layer and the jet spreads laterally outward and the jet velocity decreases downstream. Near the nozzle exit and along the central portion of the jet, a region with an almost uniform mean velocity is called the potential core. Because of the spreading of the shear layer, the potential core eventually disappears when shear layers from all sides merge. The entrainment and mixing process continues beyond the potential core region such that the velocity distribution eventually relaxes to an bell-shaped profiles as shown.
The following color-coded contours show the overall distribution of the velocity field. The jet boundary line can be interpreted as the outmost location where the velocity approaches to zero. It is clear that the jet spreads rapidly downstream.

Averaged
Jet Flow Field
Click on the triangular markers to see velocity profiles at selected downstream locations. |
 |
Click Here to see all Profiles
Courtesy PIV jet data from Mr. Bahadir Alkislar and Dr. Luiz Lourenco
The most effective way to characterize the shear layer is to plot the constant vorticity contour. Inside the shear layer, large velocity difference exists and the vorticity level is high. Away from the shear layer, the velocity gradient is small and the vorticity level is low. Therefore, the contour distribution of the vorticity level represents a good measure of the growth of the jet shear layer.