He2* tracer-line tracking velocimetry technique
The first technique we are developing is to track thin lines of He2* tracers created via laser-field ionization in He II. To create a line of He2* tracers in liquid helium, laser intensity as high as 1013 W/cm2 is needed [1]. This high instantaneous laser intensity can be achieved by focusing a laser pulse with extremely short pulse duration. With the support from FSU and the NHMFL, a femtosecond regenerative amplifier laser system has been purchased, which outputs 35-fs pulses at a wavelength λ ~ 800 nm with tunable pulse energy (up to 4 mJ) and repetition rate (up to 5 kHz). We have obtained valuable preliminary data using this modern laser equipment.
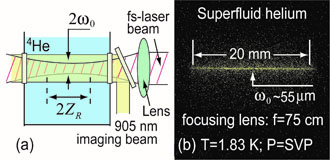
Figure 1: (a) Schematic diagram of the experimental setup for the laser-field ionization tests in helium; (b) A typical fluorescence image of a He2* tracer line created in He II; The width of the tracer lines can be adjusted by focusing the fs-laser beam using lenses with different focal length f.
Fig. 1 (a) shows a schematic diagram of the experimental setup used in our laser-field ionization tests. We focus the fs-laser beam using a lens with a focal length f and pass the beam through an optical cryostat that can be filled with liquid 4He at regulated pressures and temperatures. Anti-reflection coated windows are used to minimize laser heating. For an ideal Gaussian beam with a beam radius ω0 at the focal plane, one can define a Rayleigh range Z R=πω02/λ, over which the laser intensity drops by 50% due to beam spreading [2]. We expect the He2* tracers to be produced essentially within the Rayleigh range.
As we increase the fs-laser pulse energy, field ionization indeed occurs in helium, leading to the generation of He2* molecules. We observe that when the fs laser intensity is below the threshold for dielectric breakdown in He II (about 5×10¹³ W/cm2), a thin line of He2* tracers can be reliably produced [3], as a consequence of controlled electron avalanche ionization [1]. We then send in several pulses from a 1-kHz imaging laser at 905 nm to drive the tracers to produce fluorescent light for line imaging. In Fig. 1 (b) shows a typical fluorescence image of the He2* tracer line taken right after its creation in He-II. The width of the tracer line is about 2ω0 and its length is about 2ZR as expected. The heating in the fluid accompanying the generation of the tracer line is negligible since we did not observe any abnormal diffusion of the molecules or line stretching in static helium following the tracer-line creation [3]. In our flow field measurements, the half thickness of the tracer line (about ω0) largely sets the spatial resolution. ω0 is related to the focal length f and the incident beam radius ω f as ω0 = λ f / π ω f [2]. Therefore, by using appropriate lenses or by adjusting the incident beam radius ω f, a desired thickness of the tracer line can be achieved. We have already created tracer lines with a radius as small as 10 µm [3].
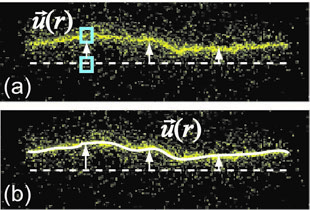
Figure 2: (a) Schematic showing how the local velocity is calculated. The dashed line marks the tracer-line initial location. (b) Calculated center line of the tracer pattern using the active contour method.
To extract quantitative velocity field, we normally allow an initially straight tracer line to move with the fluid by a drift time ∆t (see Fig. 2 (a)). The deformed tracer line is then divided into small segments, and the center of each segment is determined by a Gaussian fit of its intensity profile. The streamwise velocity u(r) can be calculated as the vertical displacement of the segment at r divided by ∆t. Valuable flow field information, such as the velocity distribution and the transverse velocity correlation, can be extracted based on u(r). This method has allowed us to obtain exciting results in the study of thermal counterflow in He II [4]. We are developing an active contour method to track the deformed lines. Instead of finding the center positions of every line segments, the center line of the whole tracer pattern can be determined (Fig. 2 (b)). Best accuracy in velocity-field calculation can be achieved. We are also upgrading our optical system in order to create complex tracer-line patterns such as crosses and grids for vorticity and strain field measurement [5].
Reference:
[1] A.V. Benderskii, R. Zadoyan, N. Schwentner, and V.A. Apkarian, "Photodynamics in superfluid helium: Femtosecond laser-induced ionization, charge recombination, and preparation of molecular Rydberg states", J Chem Phys 110 (3), 1542-1557 (1999).
[2] S.A. Self, "Focusing of Spherical Gaussian Beams", Appl Optics 22 (5), 658-661 (1983).
[3] J. Gao, A. Marakov, W. Guo, B.T. Pawlowski, S.W. Van Sciver, G.G. Ihas, D.N. McKinsey, and W.F. Vinen, "Producing and Imaging a Thin Line of He2* Molecular Tracers in Helium-4", Rev Sci Instrum 86, 093904 (2015).
[4] A. Marakov, J. Gao, W. Guo, S.W. Van Sciver, G.G. Ihas, D.N. McKinsey, and W.F. Vinen, "Visualization of the normal-fluid turbulence in counterflowing superfluid He-4", Phys Rev B 91 (9) (2015).
[5] R.B. Miles and W.R. Lempert, "Quantitative flow visualization in unseeded flows", Annu Rev Fluid Mech 29, 285-326 (1997).