
Team 302: Current Work

Components
Transciever Integration and VHDL Code
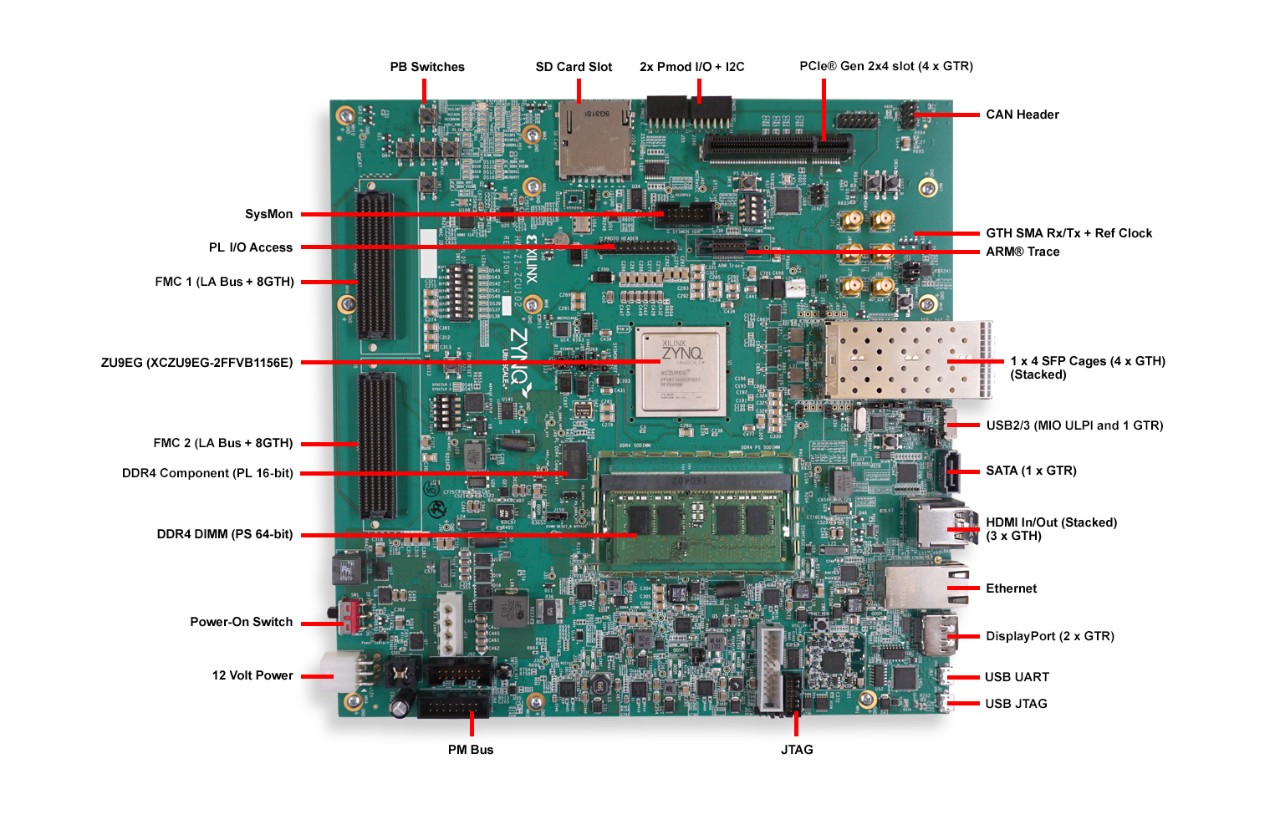
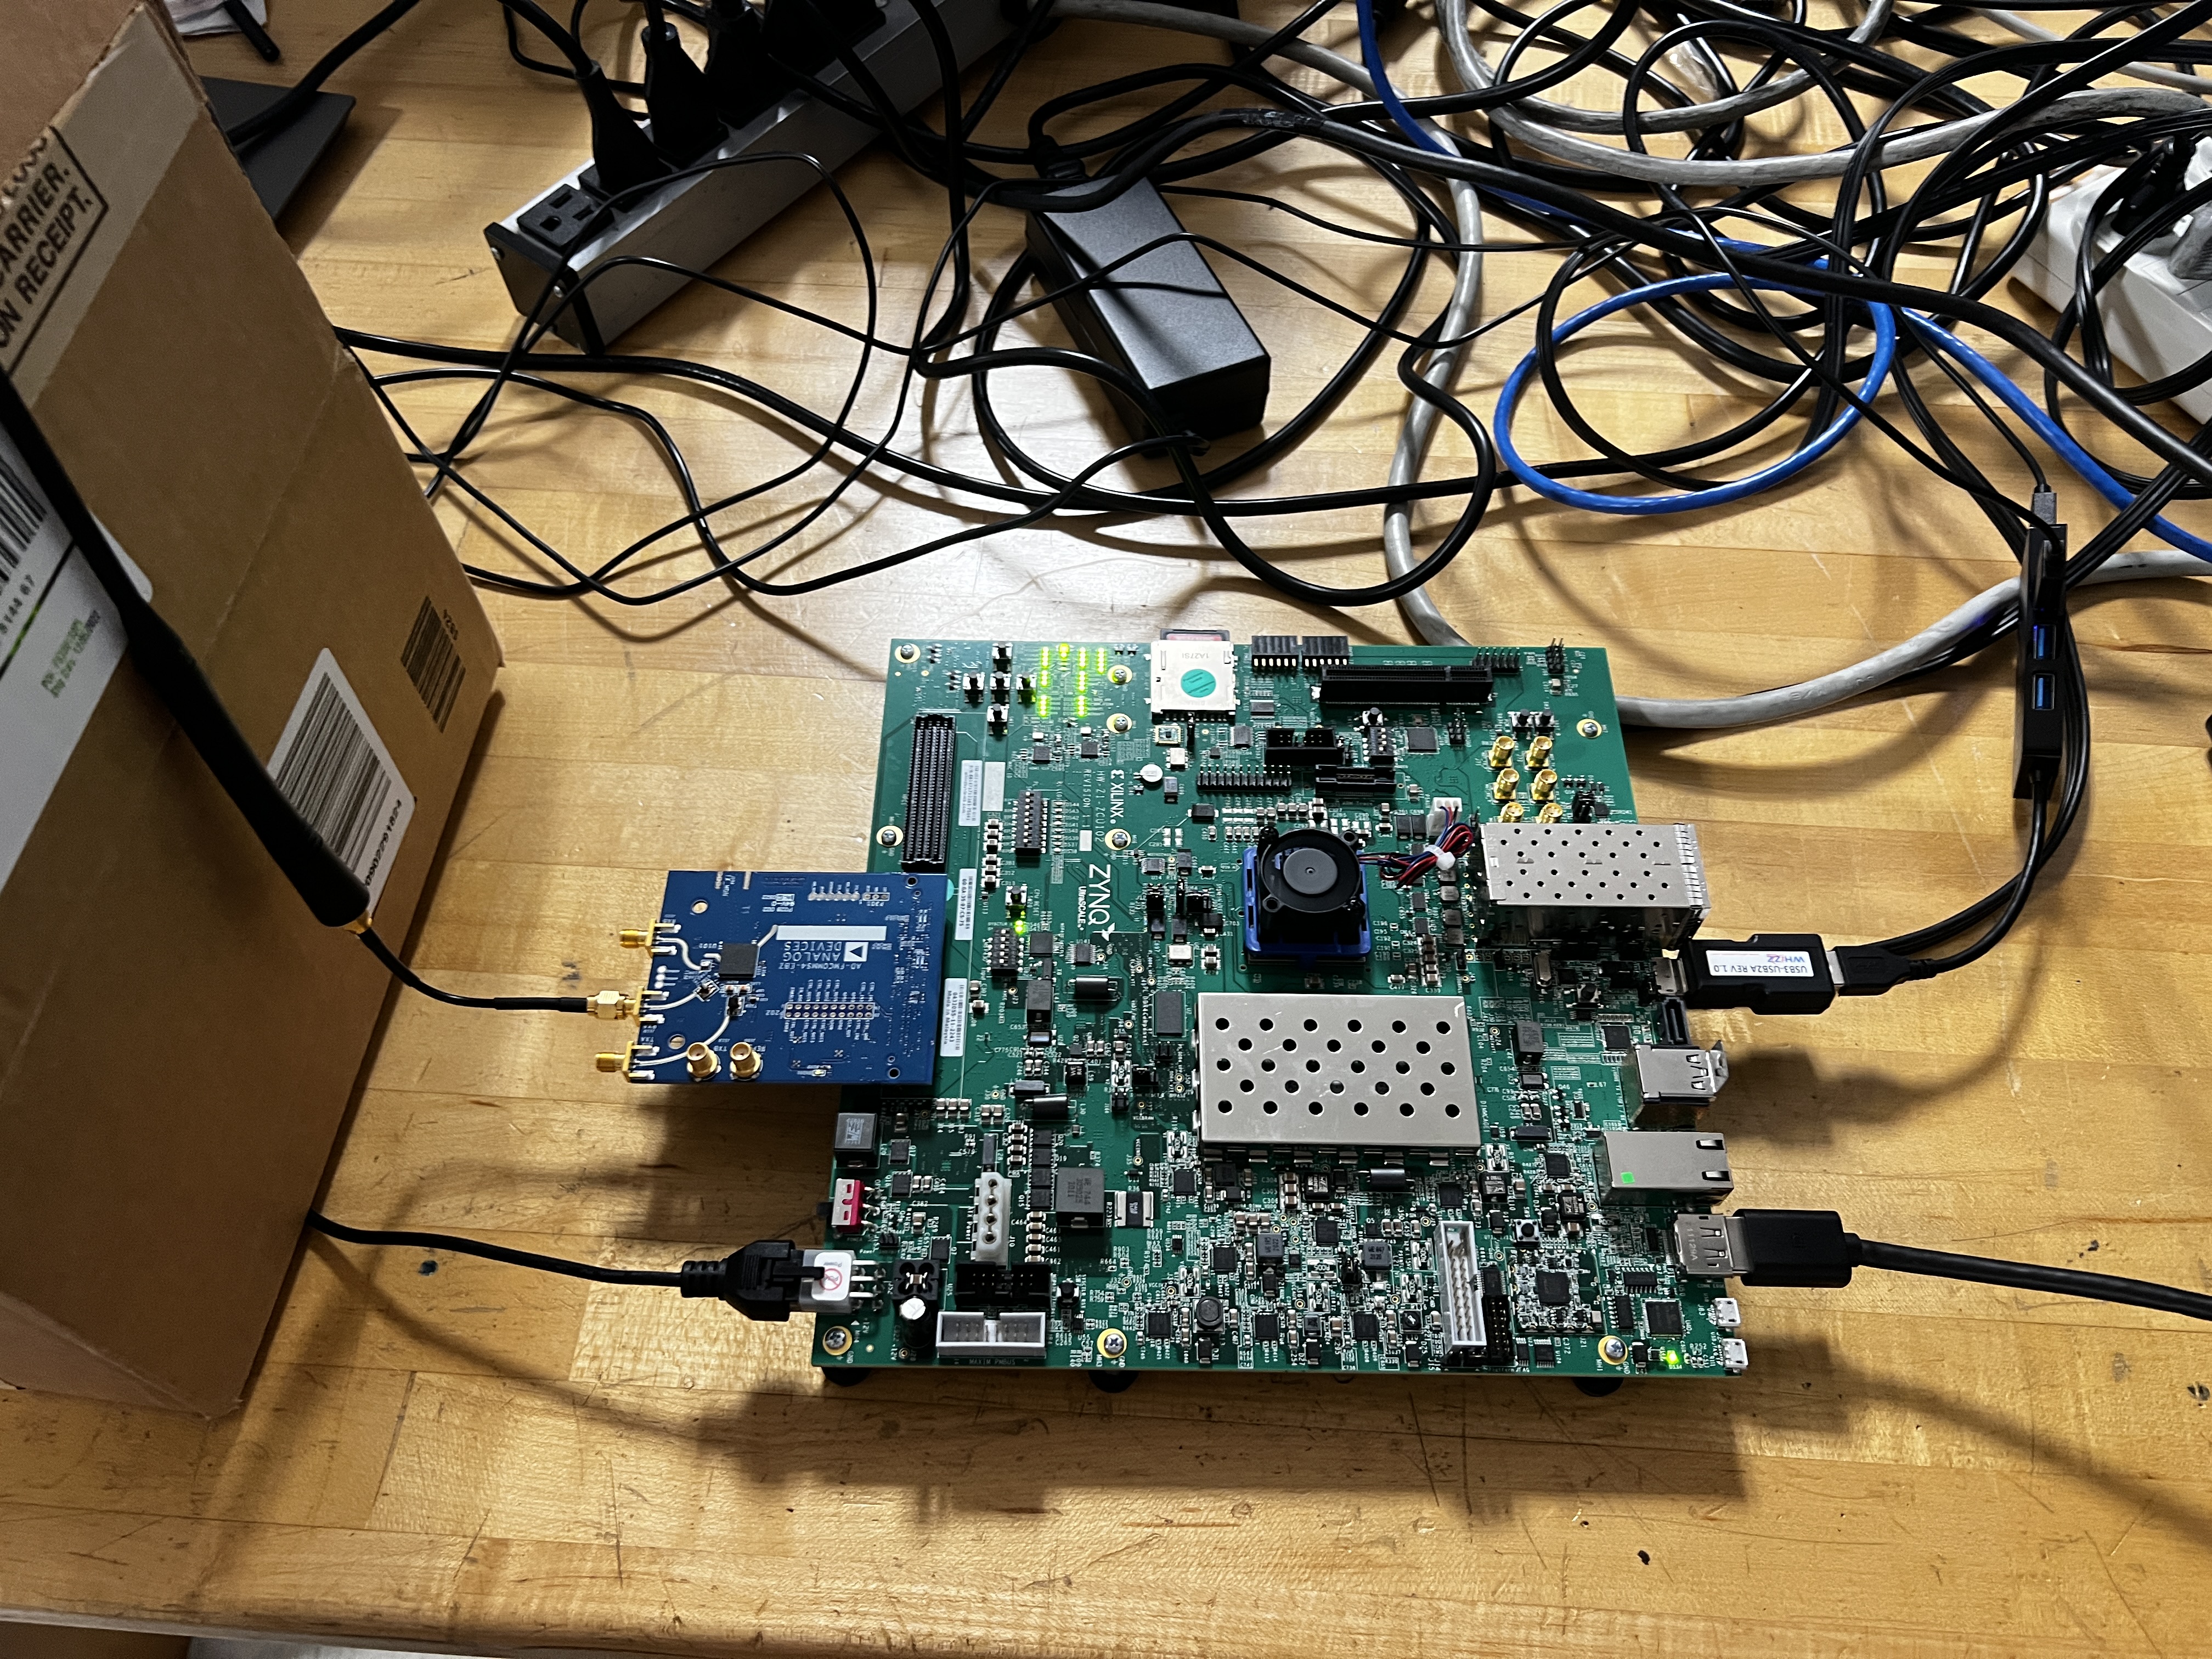
The team has successfully integrated and initialized the AD-FMCOMMS4-EBZ transciever with the ZCU102 FPGA. Due to difficulties interfacing with the transciever via VHDL, the team created a linux environment that runs on an IP Core on the FPGA. This linux enviornment allows the team to directly interact with the transciever in real time. The linux enviornment is based on an environment created by analog devices. This environment has a program called IOScope. This allows the ability to change parameters (bandwidth, gain, etc.) and allows real time analysis on the incoming signal.
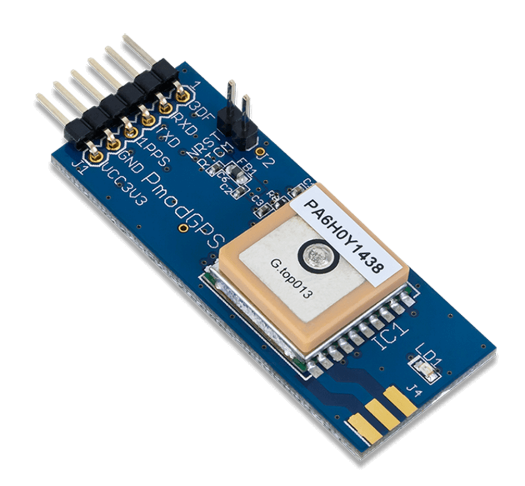
With the linux environment setup the team has started creating a no-os HDL program that will be exported as a linux image to be run on the FPGA. This HDL program written in VHDL contains the original linux environment and additional VHDL modules the team is creating. These additional VHDL modules consist of a time-stamp module, module for the PMOD GPS, and a module to write data to the SD card.
Overall the team has successfully detected the target emergency signal frequency of 155 MHz produced by a signal generator. The team can easily adjust the parameters on the transciever and analyze it's data. The current work is developing VHDL code to autonomously analyze the data and store the data when the target frequency is detected.
Testing & Results
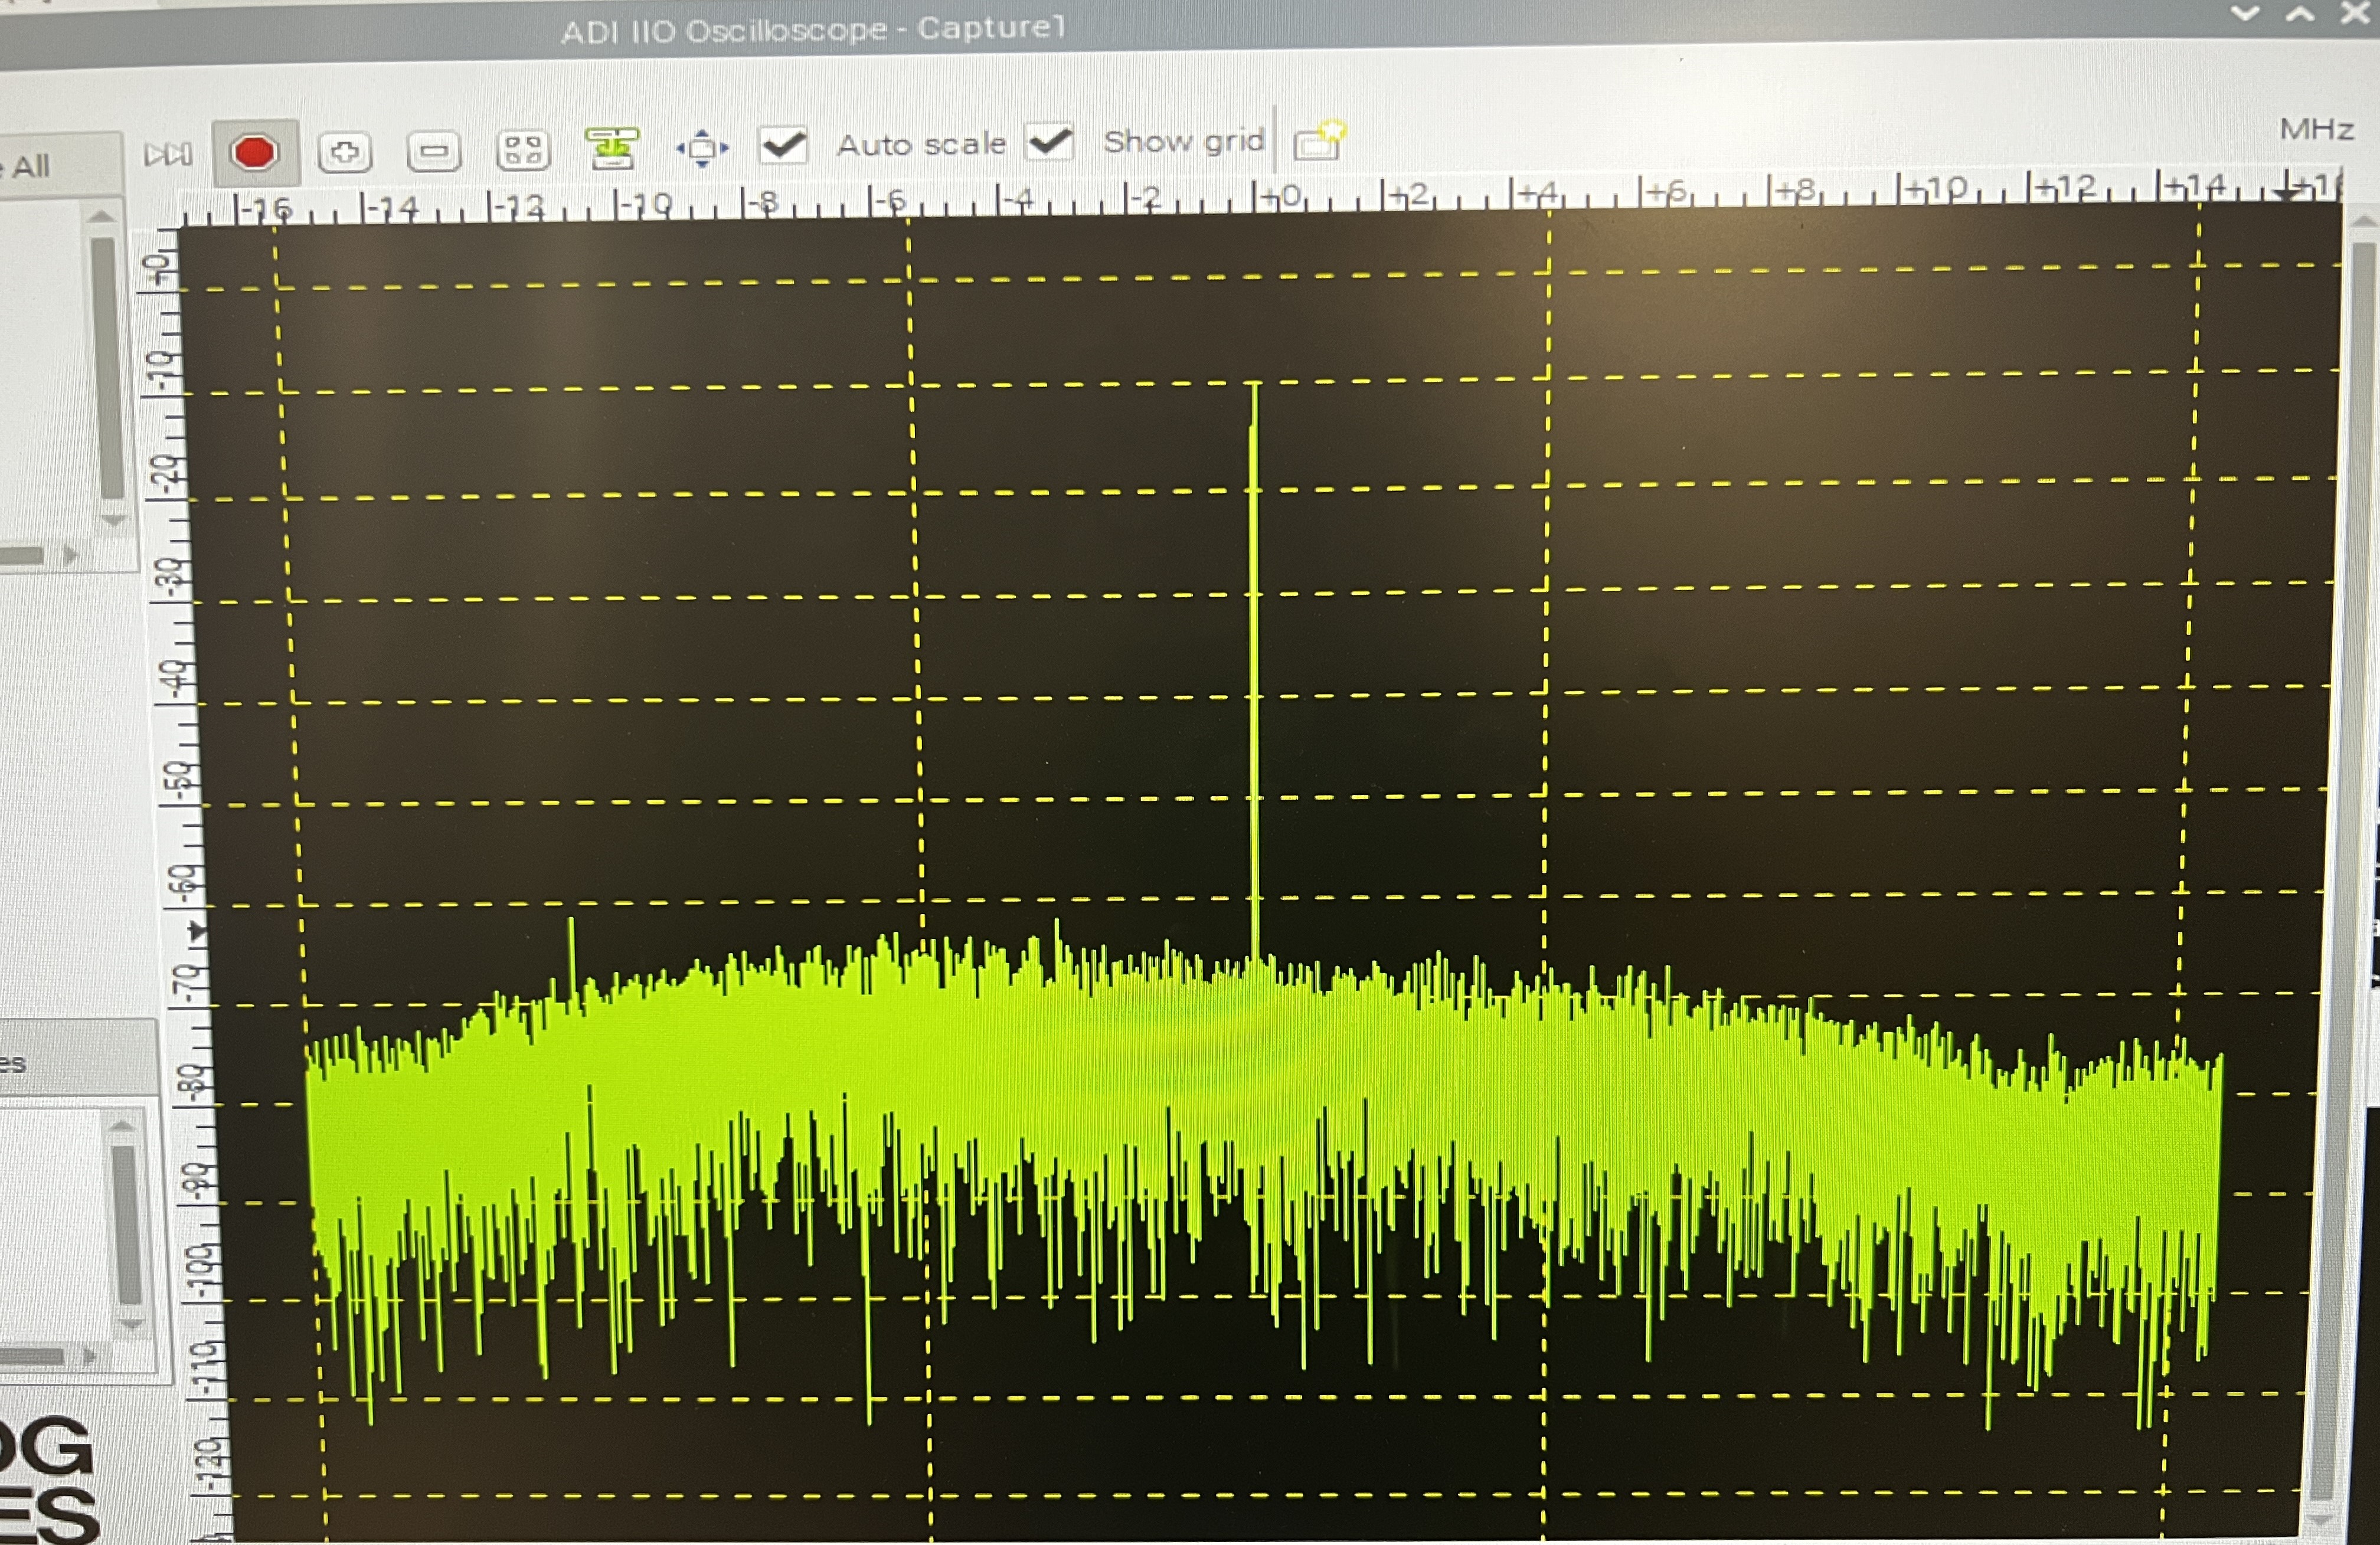
The image to the left is a spectral density of the recieved signal. The Y-axis is in dB/Hz and the X-axis is Hz with the center frequency at 155 MHz. It should be noted that the Y axis is log scale based. The spike at the center of the graph is about -10dB/Hz while the noise is max -62dB/Hz.
SNR = (-10) - (-62) = 52 dB/Hz
This SNR (signal noise ratio) at 52 dB/Hz is deemed to be extremely good and proves that the current design can properly pick up the target frequency. The team attempted to test the range of the design. This was attempted by sending the signal from the third floor and recieving the signal at the bottom floor in the College of Engineering. The signal could not be recieved. It is hypothesized that the power on the signal generator was too small and there was too much noise. Testing with a FM radio that would be present on a ship would be required to see the range weakness in the design. Overall our tests have conculded the current design can properly pick up the target frequency for analysis on the FPGA.
MATLAB Code Concept
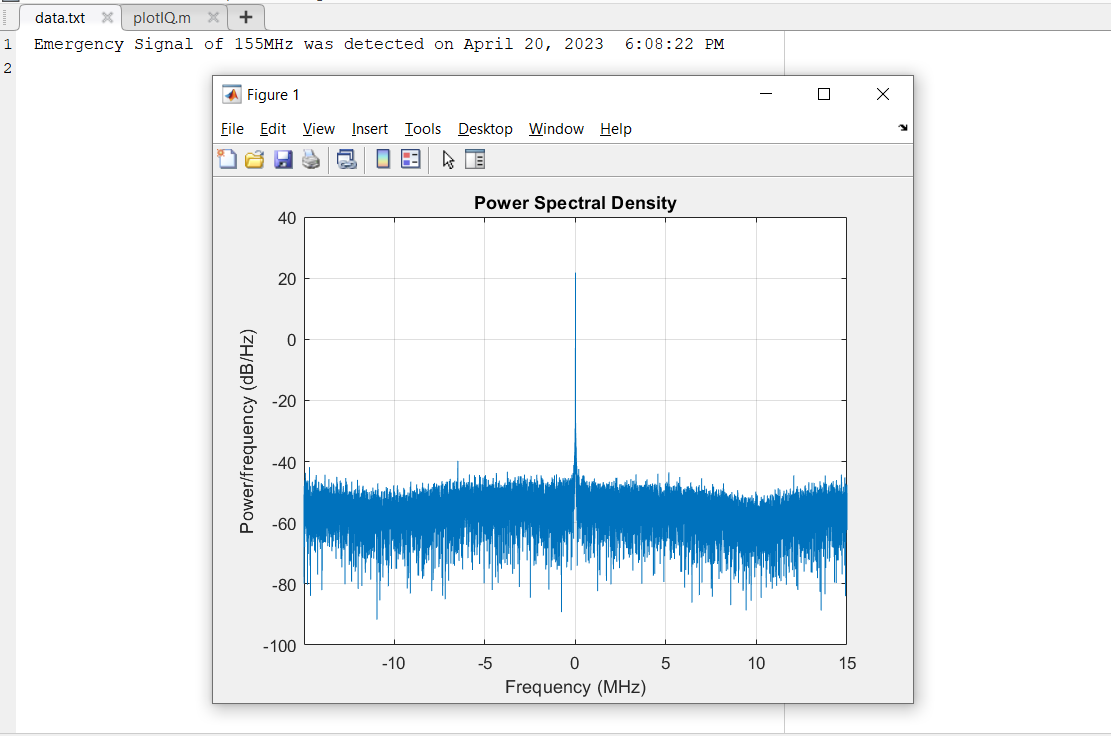
After the frequency data has been recieved it is hard saved onto the SD Card. The team is currently offloading the saved data into a MATLAB script. The saved data consists of two sets of data for V0 and V1. Both these data sets are voltages for I and Q signals respectively. The sum of I and Q is the resulting signal waveform at a specific frequency. After performing a FFT on the data in the MATLAB script, analysis on the amplitude of each frequency can be performed. The frequencies with the highest amplitude are noted. If any of these frequencies are the emergency frequency the data is stored and timestamped to a text file.
Since this MATLAB script works the team will convert it into VHDL using a MATLAB conversion tool. This VHDL module will be used as the data analysis module and the resulting data will be pushed to the SD card.