Results
As of the report due date, data has been collected and analyzed for the configurations summarized in Table 2. Raw data and power graphs similar to Figure 25 for each configuration are can be found in Appendix G. Analyzing the results shows that weather has a great impact on the panel’s performance. The power output is substantionally greater on cool, sunny days than warm cloudy days, even for the same panel positioning.

Tracking Mode |
Solar Radiation (kWhr/m2/day) |
Average Daily Power Output (kWhr) |
Estimated Monthly Power Savings (US$) |
Weather Comments |
Flat Stationary |
2.29 |
0.2402 |
$1.00 |
Sunny and Cool |
Angled Stationary |
1.32 |
0.1388 |
$0.58 |
Foggy and Warm |
One-Axis: Motor |
4.23 |
0.444 |
$1.85 |
Sunny and Unseasonably Cold |
One-Axis: Reservoir |
**** |
**** |
**** |
**** |
Two-Axis |
**** |
**** |
**** |
**** |
In order to obtain useful results for comparing tracking methods, the test duration must be increased drastically. Our results showed an increase in efficiency when a tracking system is used, but the prototype’s current testing results are not enough to determine if this is economical. Array Technologies, a manufacturer of solar trackers, conducted yearlong testing similar to what is proposed in this report’s Future Plans section. The team’s data for the tested tracking methods is overlayed as a data point located at the median testing date by assuming a panel area of 39.6in x 25.7in = 1018in2 = 0.6566m2. The team also assumed that the y-axis was plotted based on the amount of solar radiation hitting the panel rather than the panel’s electrical output. The makes the data applicable to any solar panel because the power data can be multiplied by the user’s panel’s efficiency (16% in our case) to obtain an estimate of the electrical power that will be produced. Array Technologies data can be compared because Tallahassee, FL and Sacramento, CA are separated by only 8o latitude [15,16]. This data may not hold true for other parts of the globe.
| |
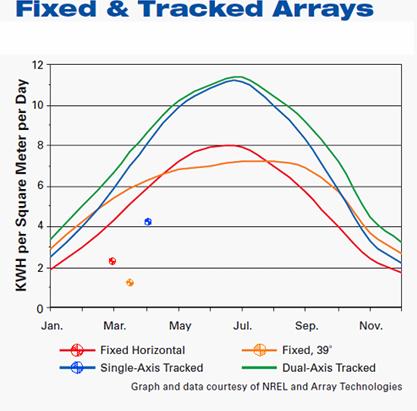
![Text Box: Figure 27 – Comparison of fixed and tracked solar array power output [12], with the team’s data overlayed](data_clip_image004.gif) |
|
Aside from analyzing how much power the solar panel is capable of producing, the team also analyzed how much power was used by the tracking system. As calculated in Section 4.3.3, the motor control circuit draws roughly 0.07W of continuous power. According to the motor specifications (part #2L003 at www.grainger.com), the motor draws 100mA at 12V under a full load, and has a maximum speed of 0.5 revolutions per minute. This is geared down using 5:1 gears, meaning the main shaft and panel rotate at 0.1 revolutions (36 degrees) per minute. The power consumed when the motor is on is determined to be:
The motor will run intermittently throughout the day, but if run continuously it would need to stay at full speed for 5 minutes to rotate 180 degrees, and then 5 more minutes the following morning to return to its starting position. Thus the monthly power usage by the motor should be close to 0.0062 kW*hr. This is added to the 0.0521 kW*hr used monthly by the motor control circuit, for a total of $0.00865 per month in lost power generation when the motor tracking is used.
|
Related Links
|