Overview
A brief description of our project
Motive for Project
 Pyrotechnics are used for tasks such as rocket separation, pilot ejection, airbag inflation, and payload deployment. The vibrations from these exlosive events can be damaging to sensitive electronic devices. Because of this it is important to simulate pyrotechnic shock to gain a better understanding of the paramters that effect it and in turn ensure the safety of vital electronics. Some important things to understand about simulating pyrotechnic shock are:
- It involves high frequency short duration impacts
- There are high acceleration forces in the thousands of G's
- These things make the test sensitive to minor changes making consistancy and repeatability hard to achieve
Technical Information
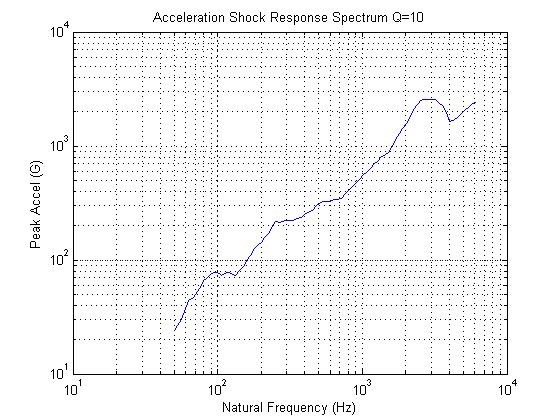
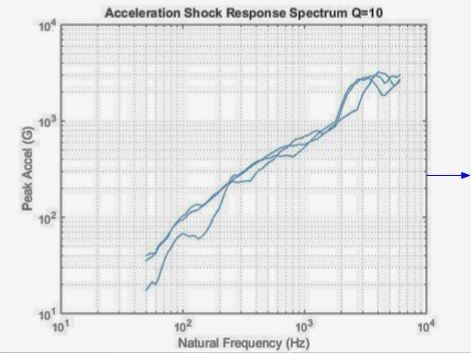
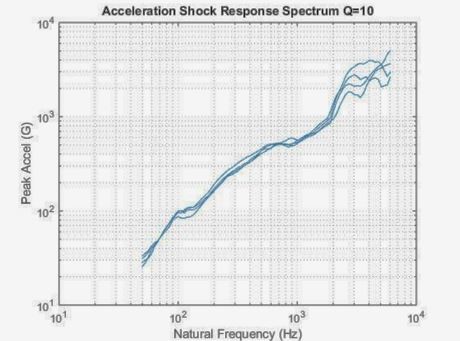
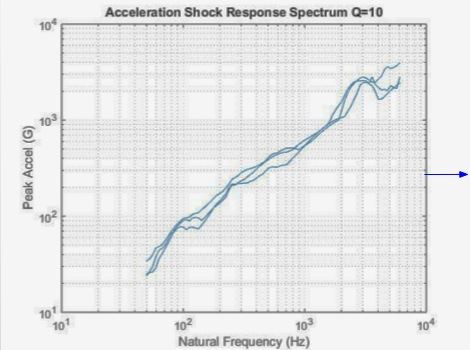
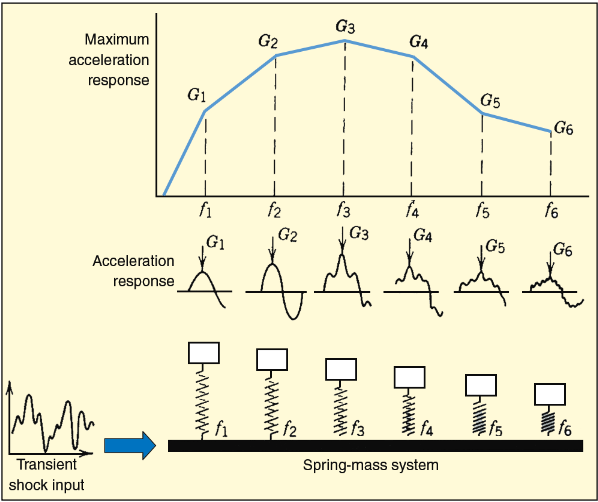 The accelerations involved in pyrotechnic shock are analyzed in what is called the Shock Response Spectrum (seen right). This method involves taking the maximum acceleration and plotting it against various natural frequencies. The plot uses frequencies from 10 to 10,000Hz, each frequency is modeled as a single degree of freedom system. A curve is formed by the combination of each point of response and the final result is what is refered to as an SRS curve.
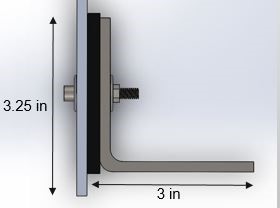
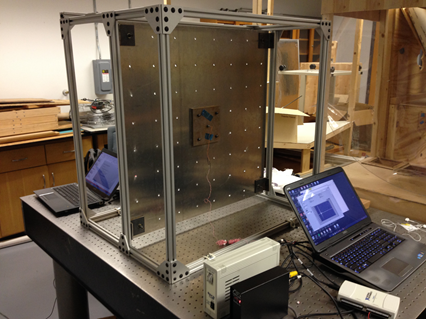
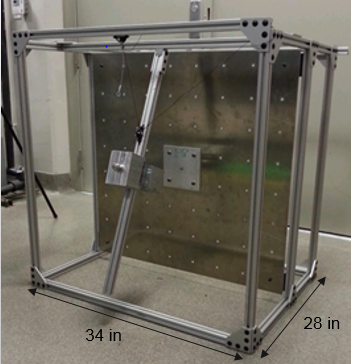 In order to simulate pyrotechnic shock our team uses a hammer blow impact test. This is one of many methods that involves using gravitaional momentum of a weighted hammer to achieve the necessary G forces. The test apparatus can be seen on the right. The hammer head swings on a pendelum and strikes the test plate at a specified location. The location can be changed by moving the hammer arm left and the hammer head up and down along the T-slot aluminum. When the hammer impacts the test article an accelerometer mounted to the other side recordeds the accelerations experienced by the plate. The max acceleration is then translated to an SRS curve.
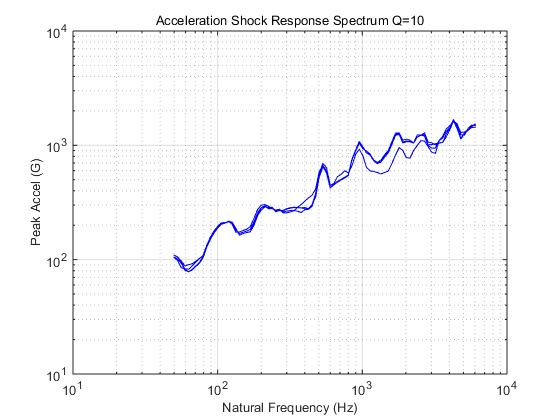
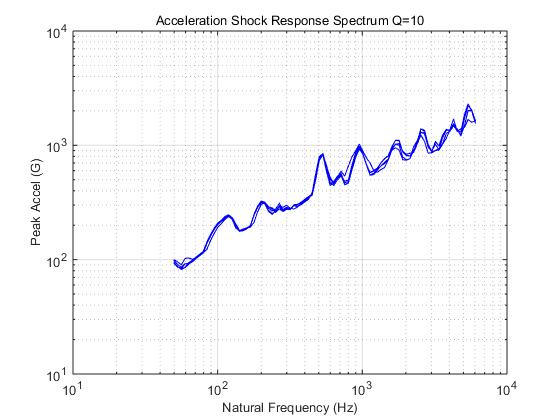
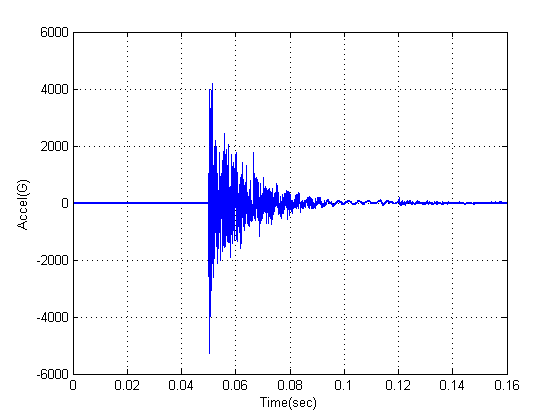
Below on the left is an example of a raw acceleration vs time plot that is recorded by the accelerometer. From here a MatLab code is used to extract the peak acceleration and plot it against the various natural frequencies resulting in an SRS curve like the one shown below on the right.
Results of Project
Much of our project entailed the pursuit of repeatability. To achieve repeatability a few changes were made to the test apparatus. First the apparatus was anchored. Anchoringreduced a significant amount of noise previously shown in the results and provided a consistant foundation. The apparatus was mounted to a large instrumental table located in the college's Mechatronics Lab. Below are two gifs one before anchoring (left) and the other after anchoring(right). Notice that the entire apparatus movies nearly an inch when un-anchored, while it is perfectly stable after anchoring.
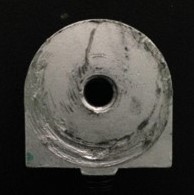 The next largest source of variablility was in the pivot that the hammer swung from. The pivot previously being used was a static pivot only meant for mounting purposes, as a result the swinging movement cause wear on the mechanism as shown in the picture to the right. This pivot was replaced by a dynamic pivot designed for 80/20 aluminum.
 Anchoring and changing the pivot greatly improved repeatability, but there were still concerns regarding the transfer of vibrations through the plate to the frame. Many methods to isolate the plate from the frame were considered, but the most viable and productive were rubber dampers(left). These dampers were installed at all four corners in which the plate was mounted to the frame.
Finally after trial testing it was determined that more accurate results were achieved if the acceleromter were mounted directly to the plate instead of using a mounting plate. This left us with the final set up pictured below.
Through the process of adjustments to the apparatus repeatability steadily increased. All of the tests were run with the same parameters that included hammer at center location, sensor at center location, and hammer dropped from 90 degrees.
Once repeatbility was checked off, variable testing could begin. The main variables to be tested were strike location and sensor location. A grid layout was created for reference of locations, the grid is viewing the plate from the side of the hammer.
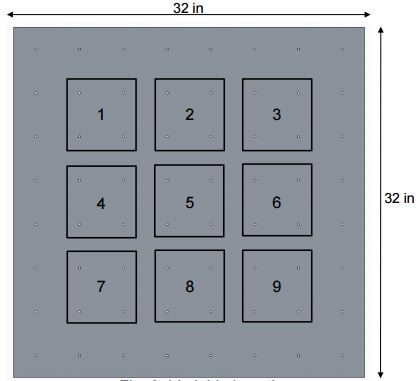
All locations have been tested by moving the strike location and also the sensor location. Below are images of strike location at points 4 and 6. More info on the results can be found in the deliverables.