|
|
|
|
Next: Bibliography |
|
In this class,
Please answer in order asked (even if you do the numerics first to guard against errors).
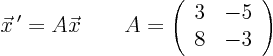
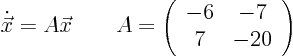
Consider the autonomous system
First analyze this system analytically:
Suitable programs to do this can be found on the web. Some I saw previously:
http://www.math.uu.nl/people/beukers/phase/newphase.html
http://www.scottsarra.org/applets/dirField1/dirField1.html
http://www.math.rutgers.edu/courses/ODE/sherod/phase-local.html
See here for Matlab software. (You will need to convert to an ODE by taking the ratio of the equations, and then the software might crash when it divides by zero if it hits a critical point.)
You will need to use a screen grabber to make a copy that you can print. Typically you press Alt+PrintScreen or Shift-PrintScreen to get a printable copy of the active Window.
Additional note: It has been brought to my attention that the above phase plane plotters may no longer work because the College of Engineering no longer installs Java on the web browsers. Therefore I have created a little Matlab program that does essentially the same thing. It can be found at:
http://www.eng.famu.fsu.edu/~dommelen/courses/aim/odesols/phaseplane.m
This program is set up to do the Van der Pol oscillator. To make it work with the system you are solving, you will need to make a few minor changes to this program, as explained in the comments at the start of the file. You will also need to create a function file myfunc.m. Pattern it after the Van der Pol example:
http://www.eng.famu.fsu.edu/~dommelen/courses/aim/odesols/vanderpol.m
If you use MS Notepad to create this file, do not forget to save as
All Files”, not “Text Files
.
If you do not have Matlab, the free Octave clone will do just fine.
You can use File/Save As
in the plot window to save
the plot for printing.
State for each critical point whether critical point analysis must give the right solution near the point. In other words, could the real lines be qualitatively different from what you drew?