Performance Specifications
The Performance Specifications define what the system being designed must do, and not how it must do it. In this step a list of needs and wants should be created. The needs are customer requirements, while the wants are engineering desires.
Example
Three columns are usually needed for this table. The customer needs are demands (D), given an importance rating of ten, which must be fully realized; while the groups wishes (W) are rated on the group’s level of importance. These demands and wishes are placed on the left hand side of the table, while their importance is rated on the right hand side of the table. The actual specification is placed in the middle of the table.
|
Demand or Wish |
|
Importance 1 –10 (10 is most important) |
|
D |
Capable of harvesting several types of vegetables |
10 |
|
D |
Does not require manmade power source |
10 |
|
D |
Uses less than $100.00 worth of material other than wood |
10 |
|
W |
Can be operated by one person |
5 |
|
D |
Capable of harvesting several rows of vegetable simultaneously |
8 |
|
W |
Does not damage crops |
9 |
|
W |
High Storage Capacity |
7 |
|
W |
Capable of sifting out excess dirt from vegetables |
6 |
|
W |
Simple shapes for ease of construction and replacing broken parts |
4 |
|
W |
Few moving parts to increase lifespan and ease of manufacturing |
4 |
|
W |
Resistant to environmental elements |
7 |
|
W |
Useful for other aspects of farming as well as vegetable collection |
2 |
|
W |
Pre-cools vegetables for storage |
1 |
|
W |
Separate storage containers for different types of vegetables |
2 |
House of Quality
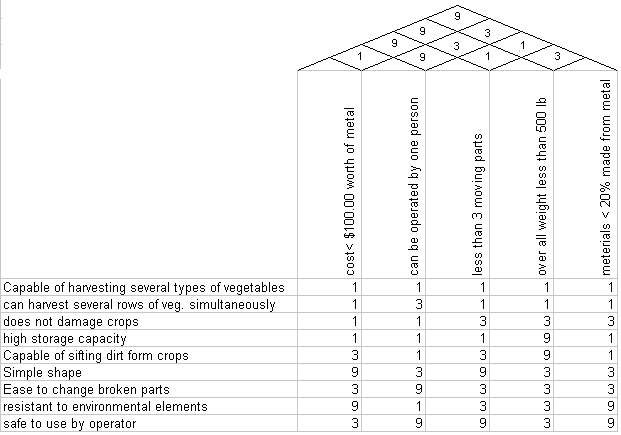
The House of Quality is a very useful comparison table. The way to draw is it as follows:
(a) Identify customer requirements in terms of product attributes. This can be done through market research such as Product Clinics (customers are quizzed about their likes and dislikes about the product) and Hall Tests (various products are displayed and customers are asked to inspect and critique the products).
(b) Draw a matrix of product attributes against engineering characteristics. Attributes are, in general, vague; characteristics are usually measurable and quantifiable.
(c) Identify the relationship between engineering characteristics and product attributes. Usually, a 9 represents a strong relationship, a 6 represents a medium relationship, and a 3 represents a weak relationship. When these are not related, leave it blank.
(d) Identify any relationships between the engineering characteristics themselves. This adds the roof to the matrix.
The result should look as follows
