Projects
Daily Covid 19 case counts on Florida census tracts (animated, July-Oct 2020)
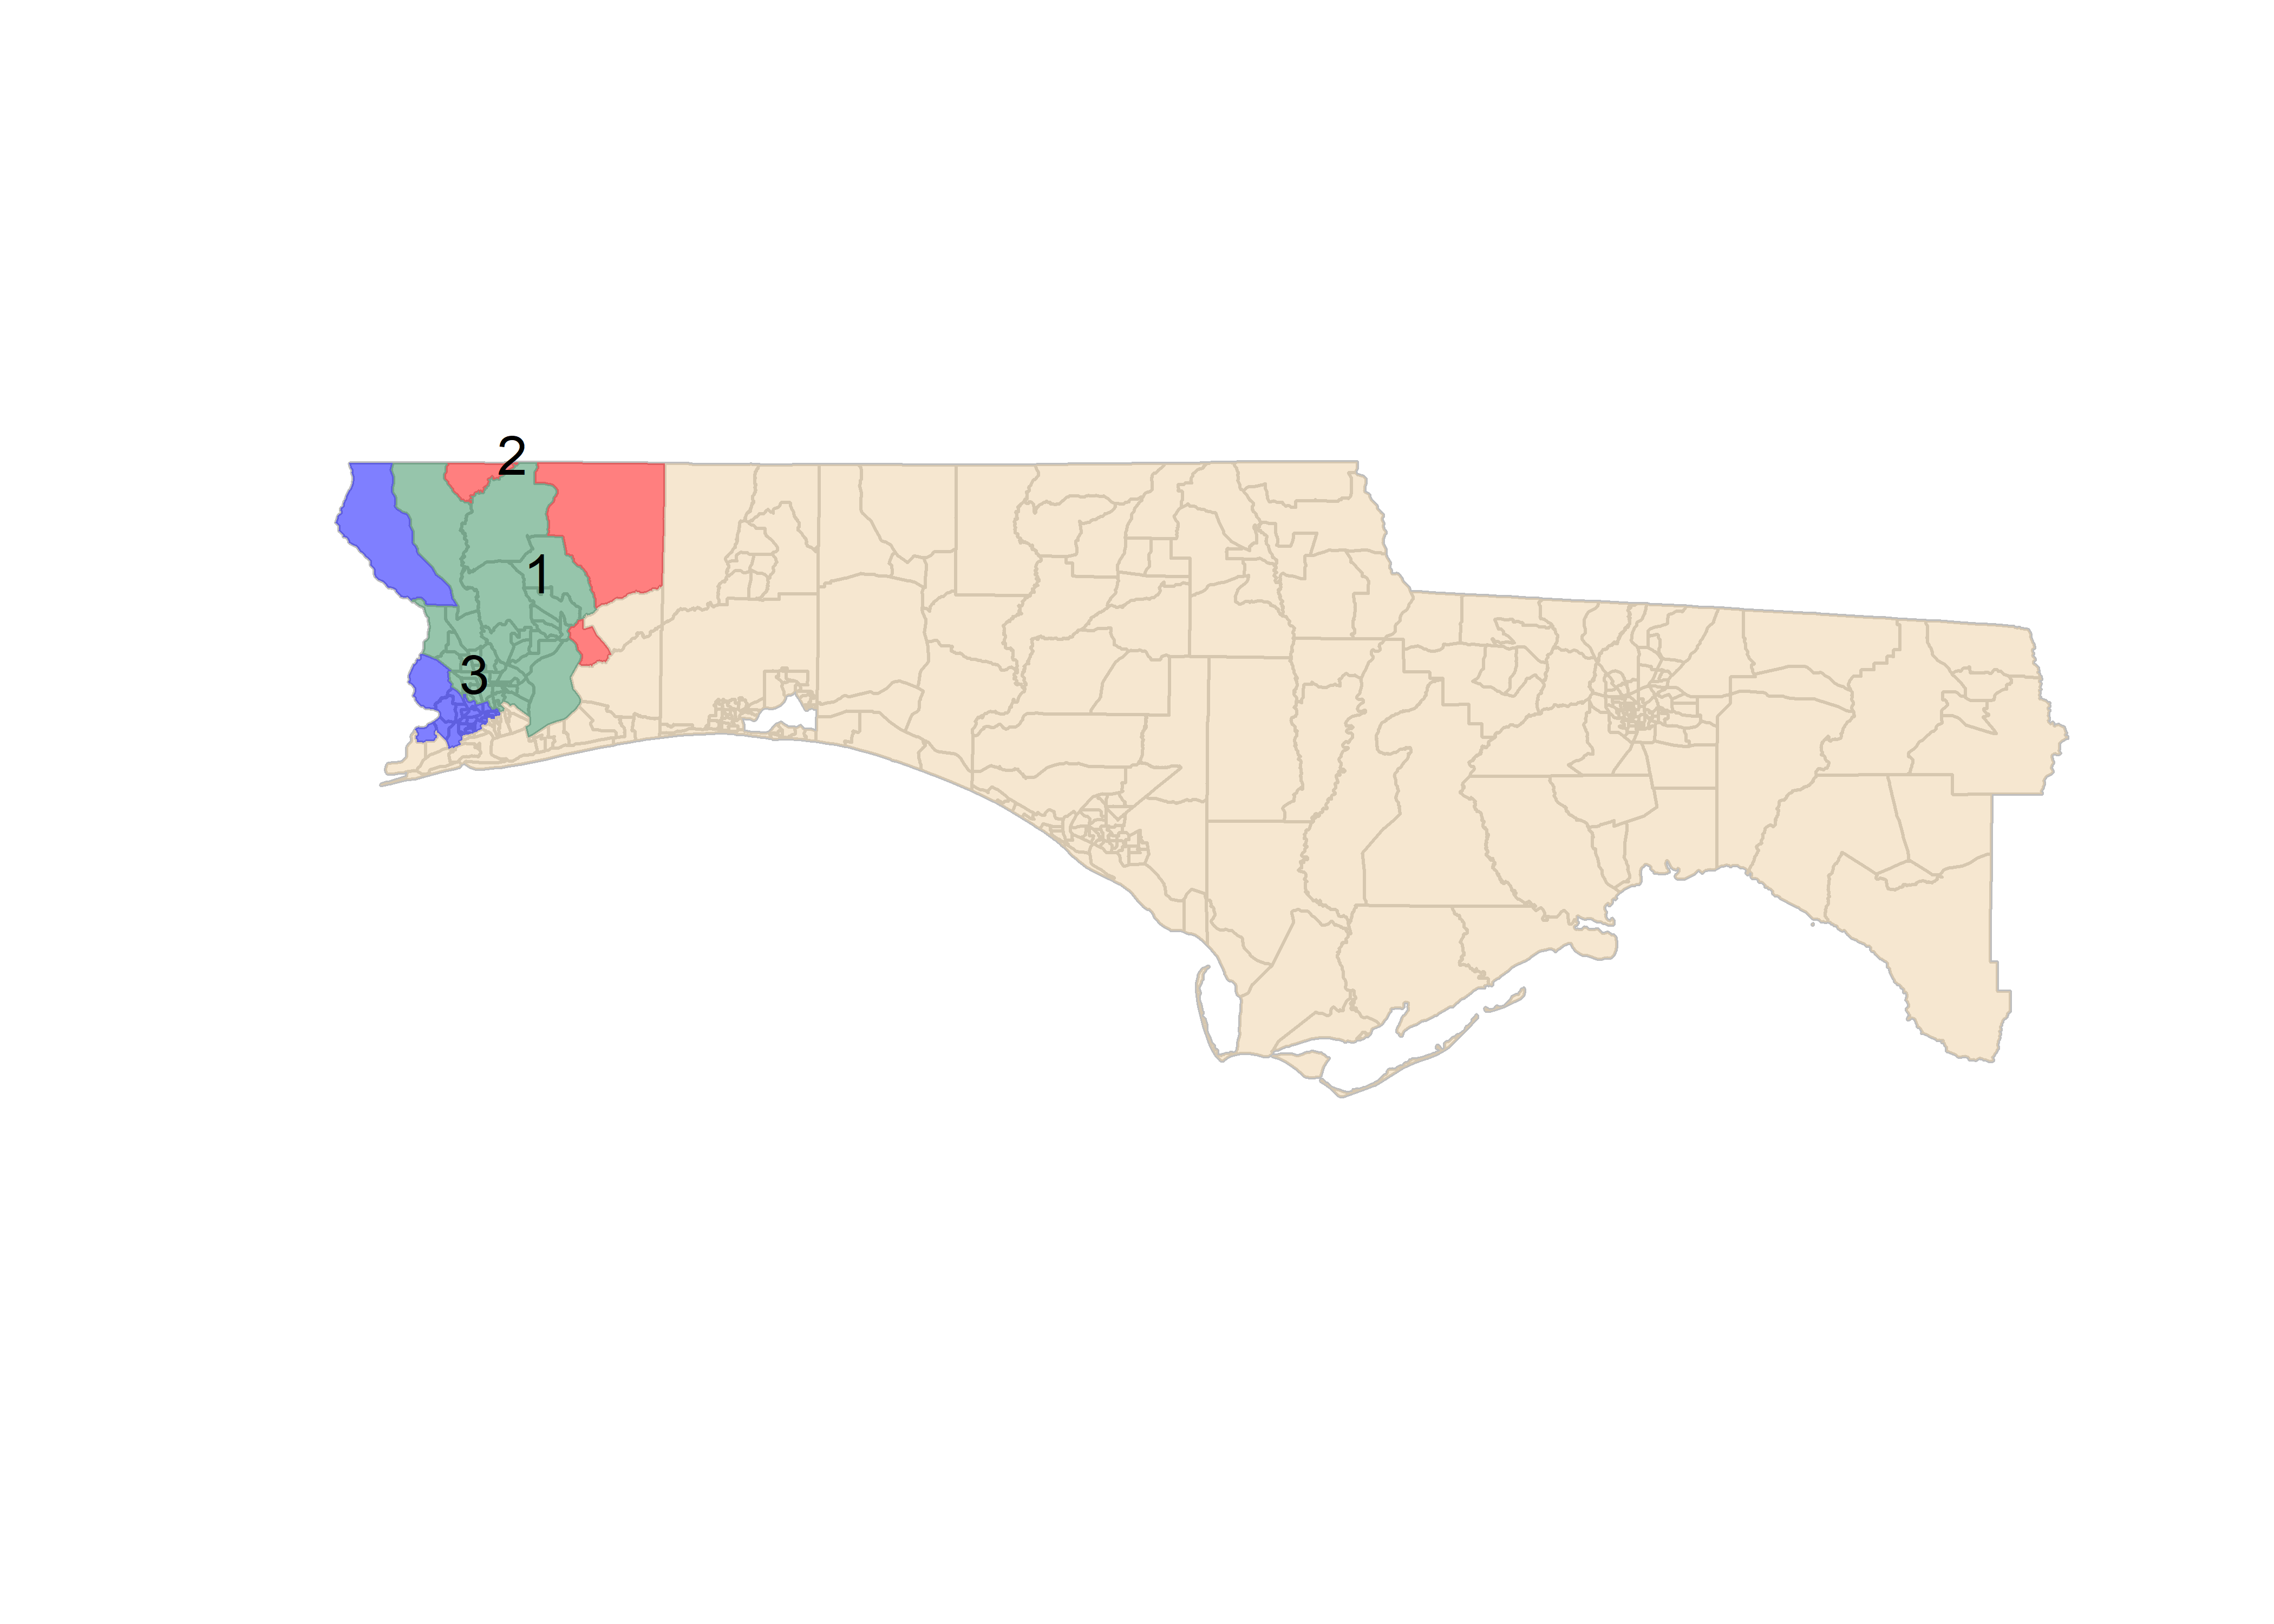
Covid 19 clusters for Florida Panhandle
Spatio-temporal health surveillance
Public health disease surveillance consists of the systematic collection, analysis, and interpretation of data on chronic and infectious diseases to detect changes in disease incidence or emerging disease clusters.
A major limitation in most of the currently employed health surveillance methods used in epidemiological studies is the assumption that the regional observations are independently distributed and it is not straightforward to account for risk factors in the surveillance procedure. In this research, we study a set of spatial modeling approaches to account for risk factors and spatial autocorrelation in spatiotemporal surveillance. In particular, simultaneous autoregressive (SAR) models, a class of spatial regression models popular in the econometrics literature, are extensively studied within the classical space-time cumulative sum (CUSUM) change detection framework for detecting changes in the spatially distributed count data. A case study is presented to illustrate the methodology for prospective detection of COVID-19 clusters in Florida Panhandle census tracts while accounting for social vulnerability of underlying communities.
Space–time surveillance of count data subject to linear trends
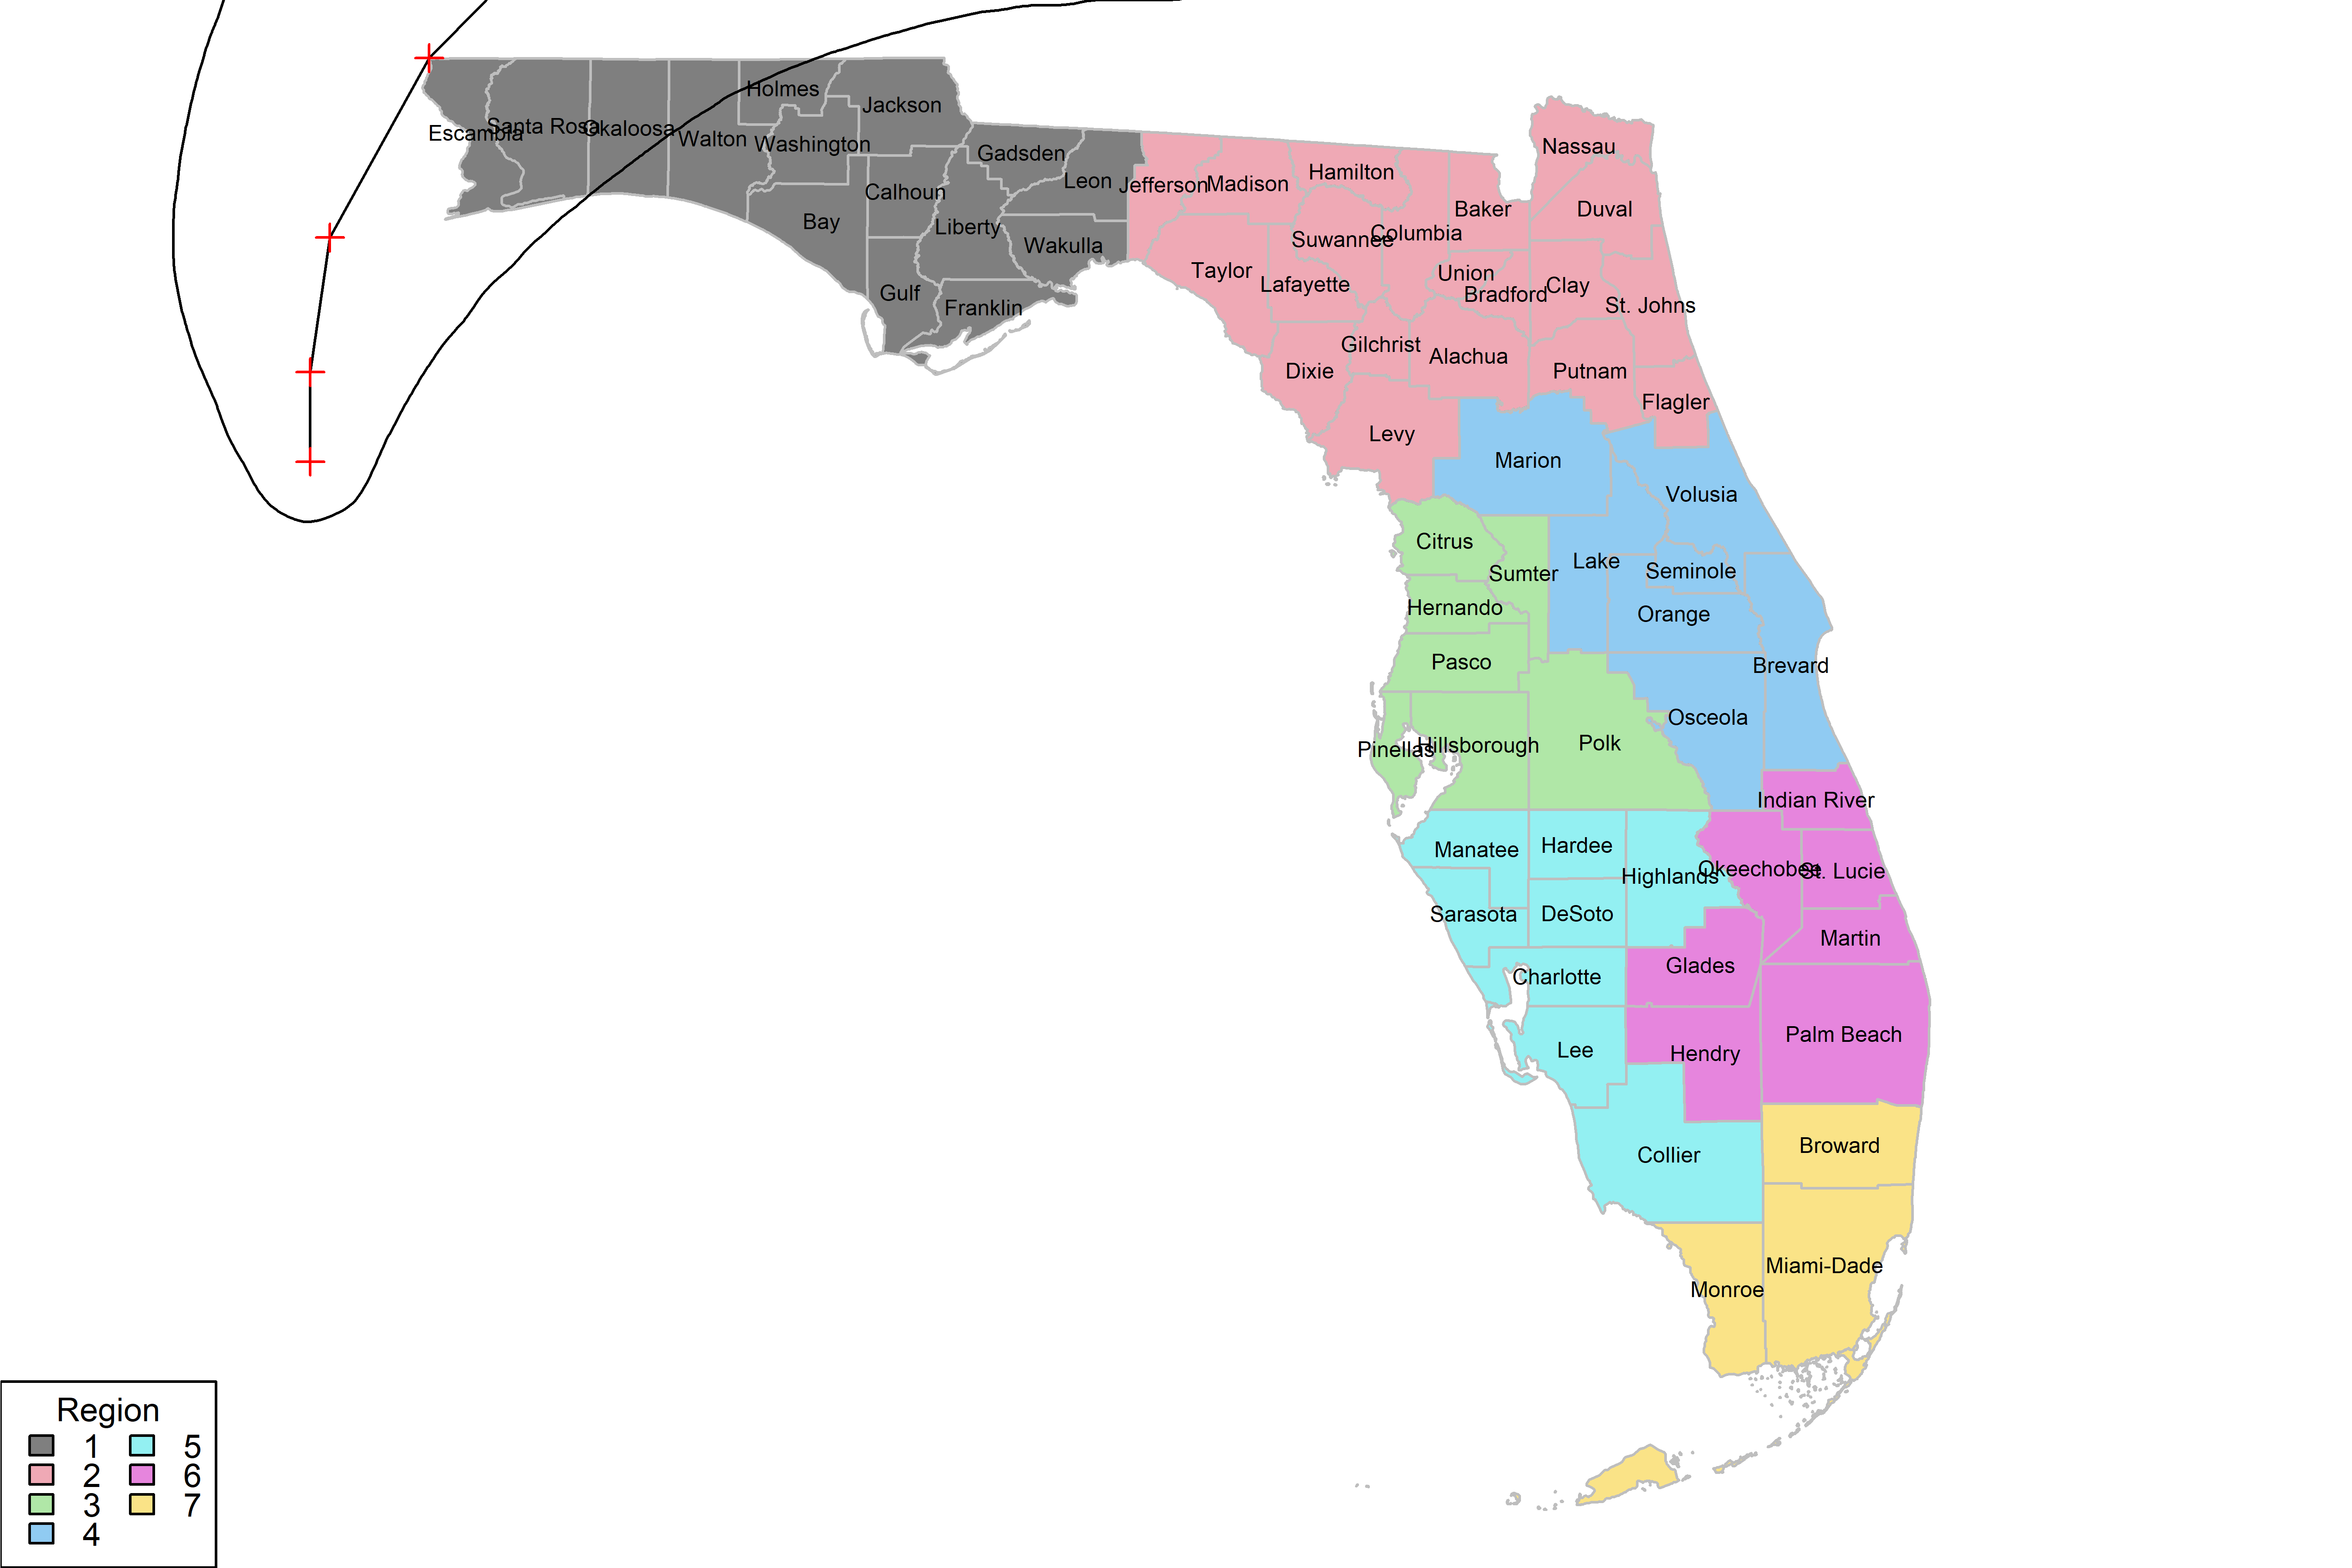
Regions of Florida and the Hurricane Sally 5-day ahead forecast for Sep 15, 2020
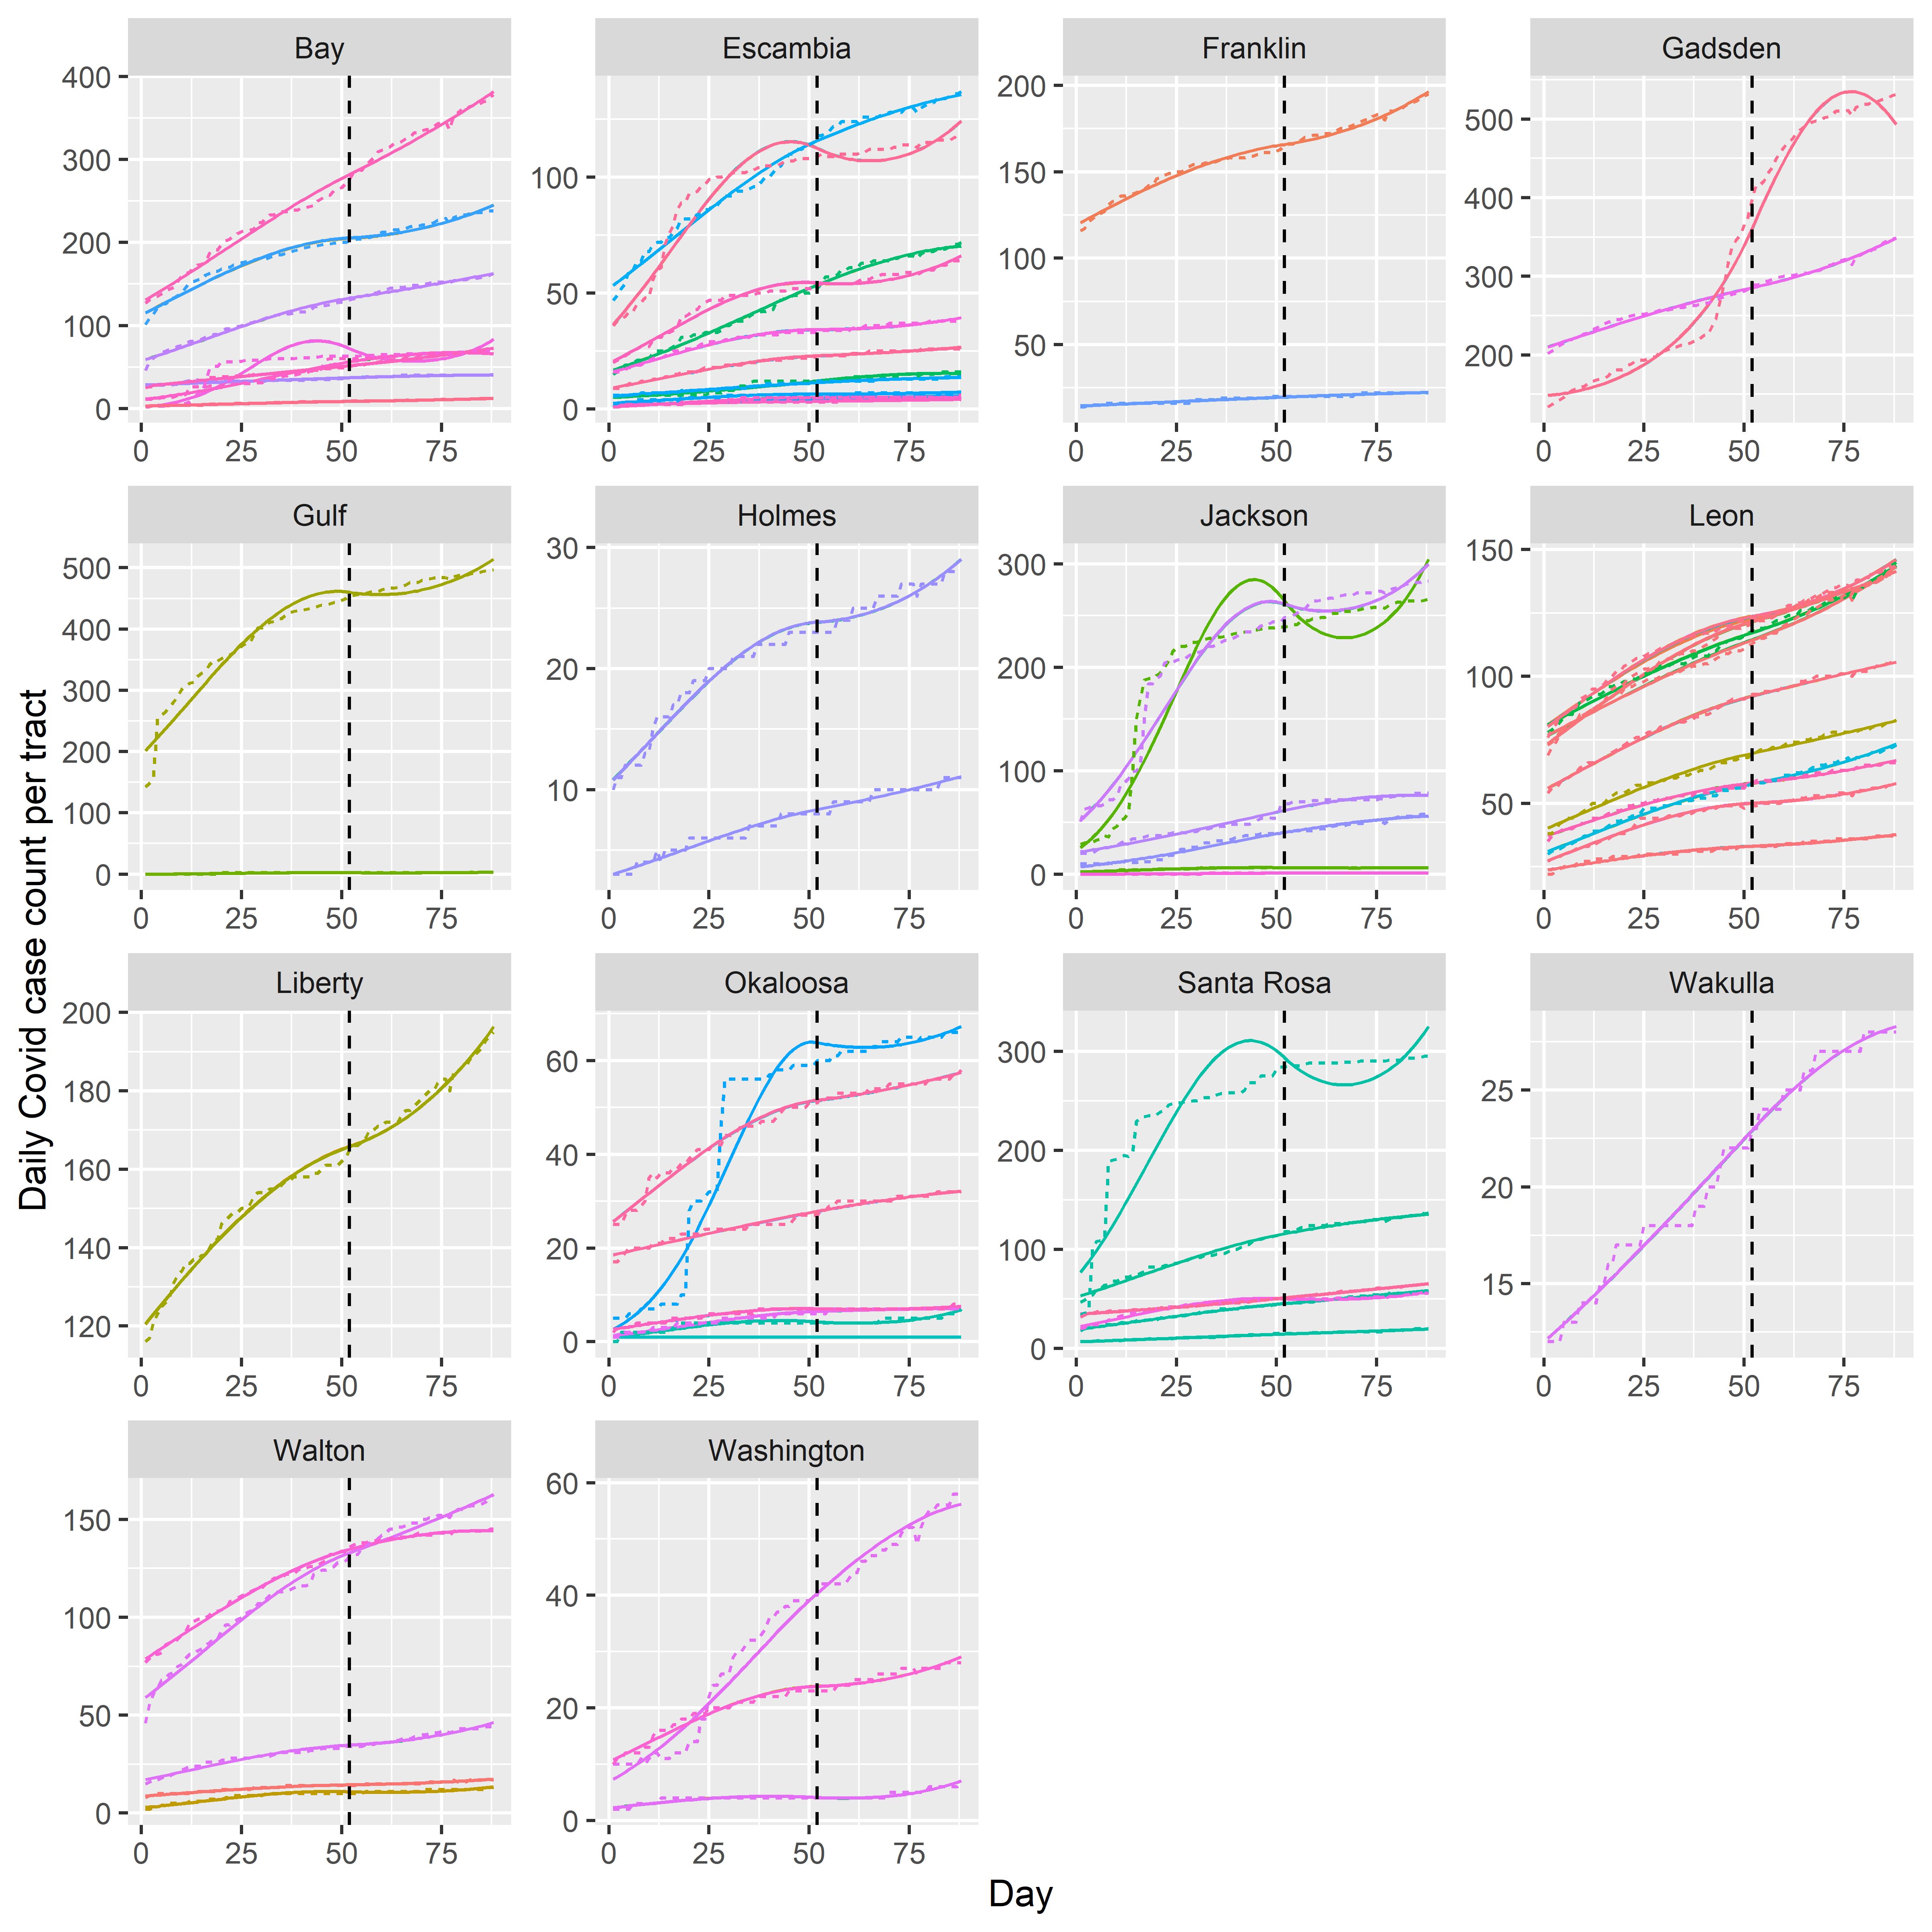
Daily Covid 19 case counts and predictions for Region 1 census tracts (7/22/20-10/17/20). Vertical line: hurricane Sally landfall.
Community resilience against pandemics and geophysical hazards
Large-scale disasters, in particular, concurrently occurring geophysical hazards and pandemics, disproportionately affect disadvantaged communities. The knowledge of factors that describe a community’s social vulnerability against disasters is crucial to identify populations most likely to need support before, during, and after a disaster and determine how resources might be allocated for mitigation and response.
In this research, using publicly available spatial social vulnerability data and daily Covid-19 case counts at the U.S. census-tract level, we assess the association between social vulnerability and the pandemic spread during a concurrently occurring hurricane in Florida. A multilevel mixed-effects modeling methodology is proposed to understand how the census-tract infection count trajectories (daily new cases) are associated with the demographic and socioeconomic characteristics of communities and a disruptive hurricane occurring during the study period. The proposed multi-level modeling of disaster and pandemic data has practical implications for emergency management and public health policy for coordinating resource allocation efforts between state, region, and community.
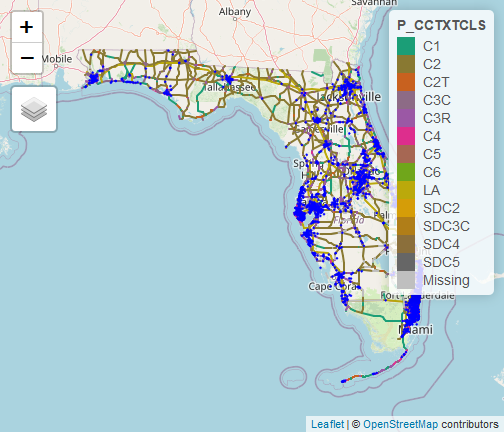
Florida roadway context classifications and traffic crash points observed in 2018. Click the link for an interactive map.
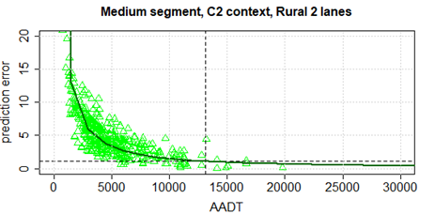
AADT thresholds to make Fatal-injury crash prediction errors less than $200K annually on C2 (Rural) Context Classification
Transportation data analytics
Transportation professionals widely use Negative Binomial distribution-based safety performance functions (SPFs) for predictive crash analysis. To assist the Florida Department of Transportation practitioners the overall goal of this project was to provide thresholds of certain SPF parameters that ensures reliable crash predictions are obtained consistently. A multilevel statistical model was constructed to quantify the SPF prediction errors for various context classifications and to compute the minimum Average Annual Daily Traffic (AADT) threshold to guarantee the SPF prediction errors are consistently smaller than a desired reliability metric.
Lamb wave sensor- network for fatigue test specimens
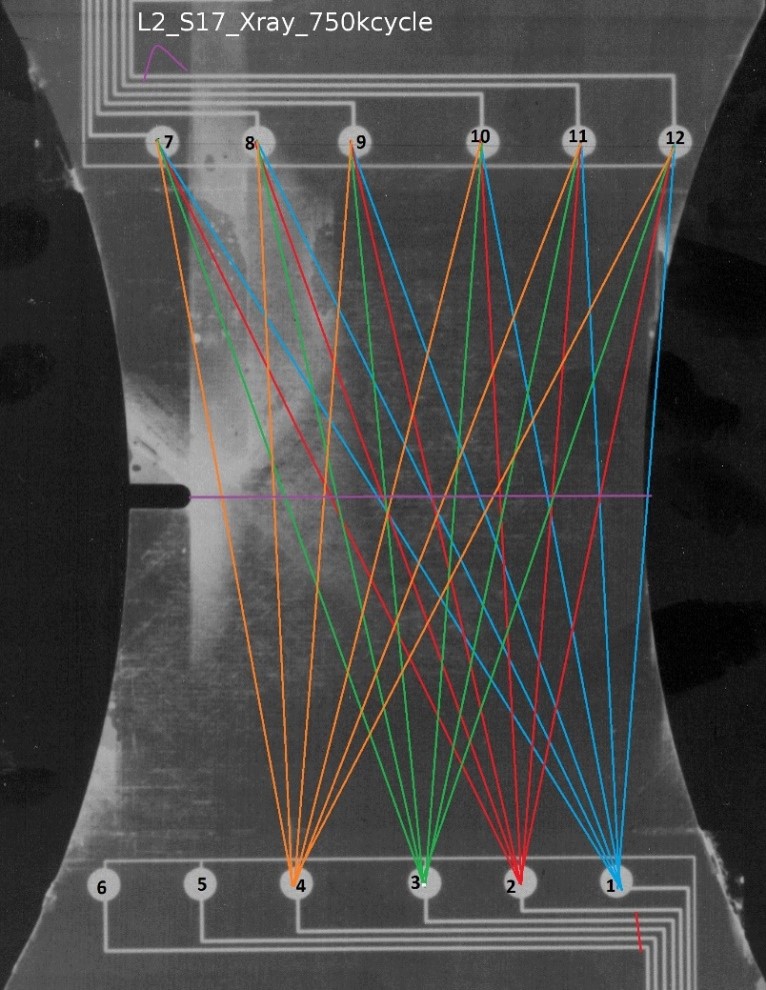
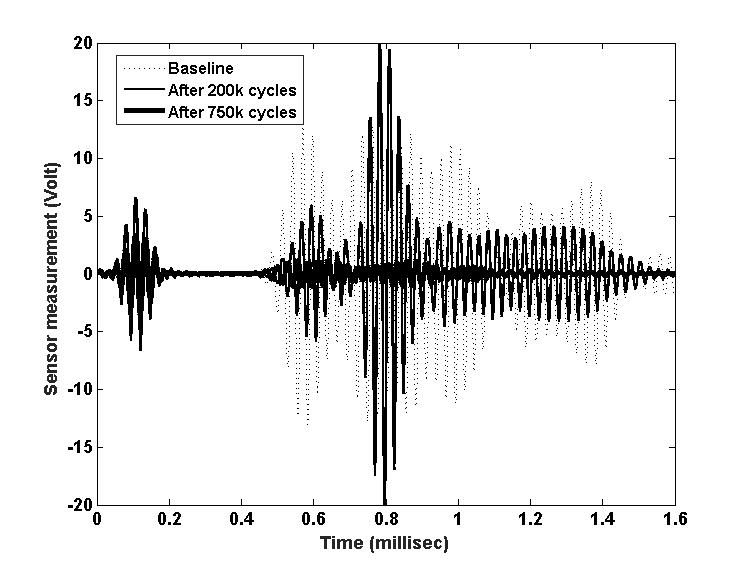
Lamb wave sensor data (top) Delamination data (bottom)
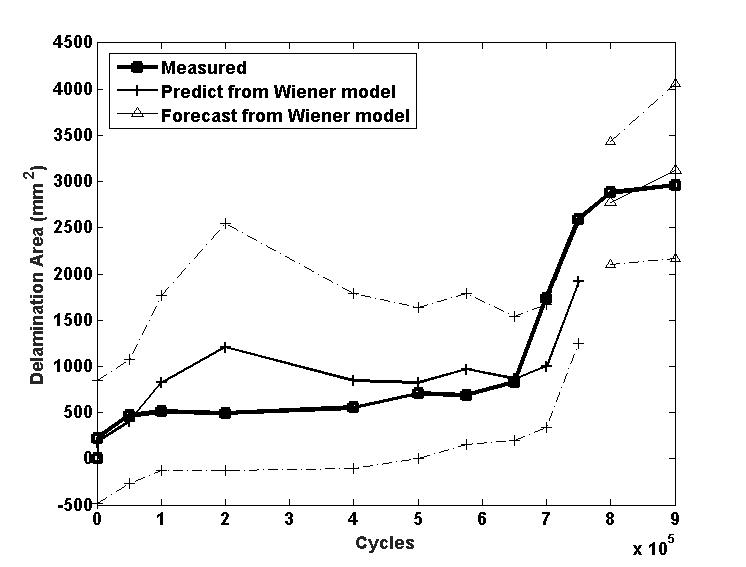
Non destructive testing and life cycle management of engineering structures
Predictions of the remaining safe useful life of structural and mechanical components is crucial for cost effective management of critical infrastructure. In this research we develop a probabilistic approach for predicting the remaining useful life of composite structures using embedded Lamb wave sensor data. A principal component regression model is constructed to extract damage sensitive features of a Lamb wave sensor signal and establish a relation between the features and measured composite delamination areas. A Wiener process is then developed to model the random delamination growth and predict future damage and failure time probability. Method is illustrated on real sensor data collected under run-to-failure fatigue loading conditions.
Probability distributions of wind speed and roof capacity


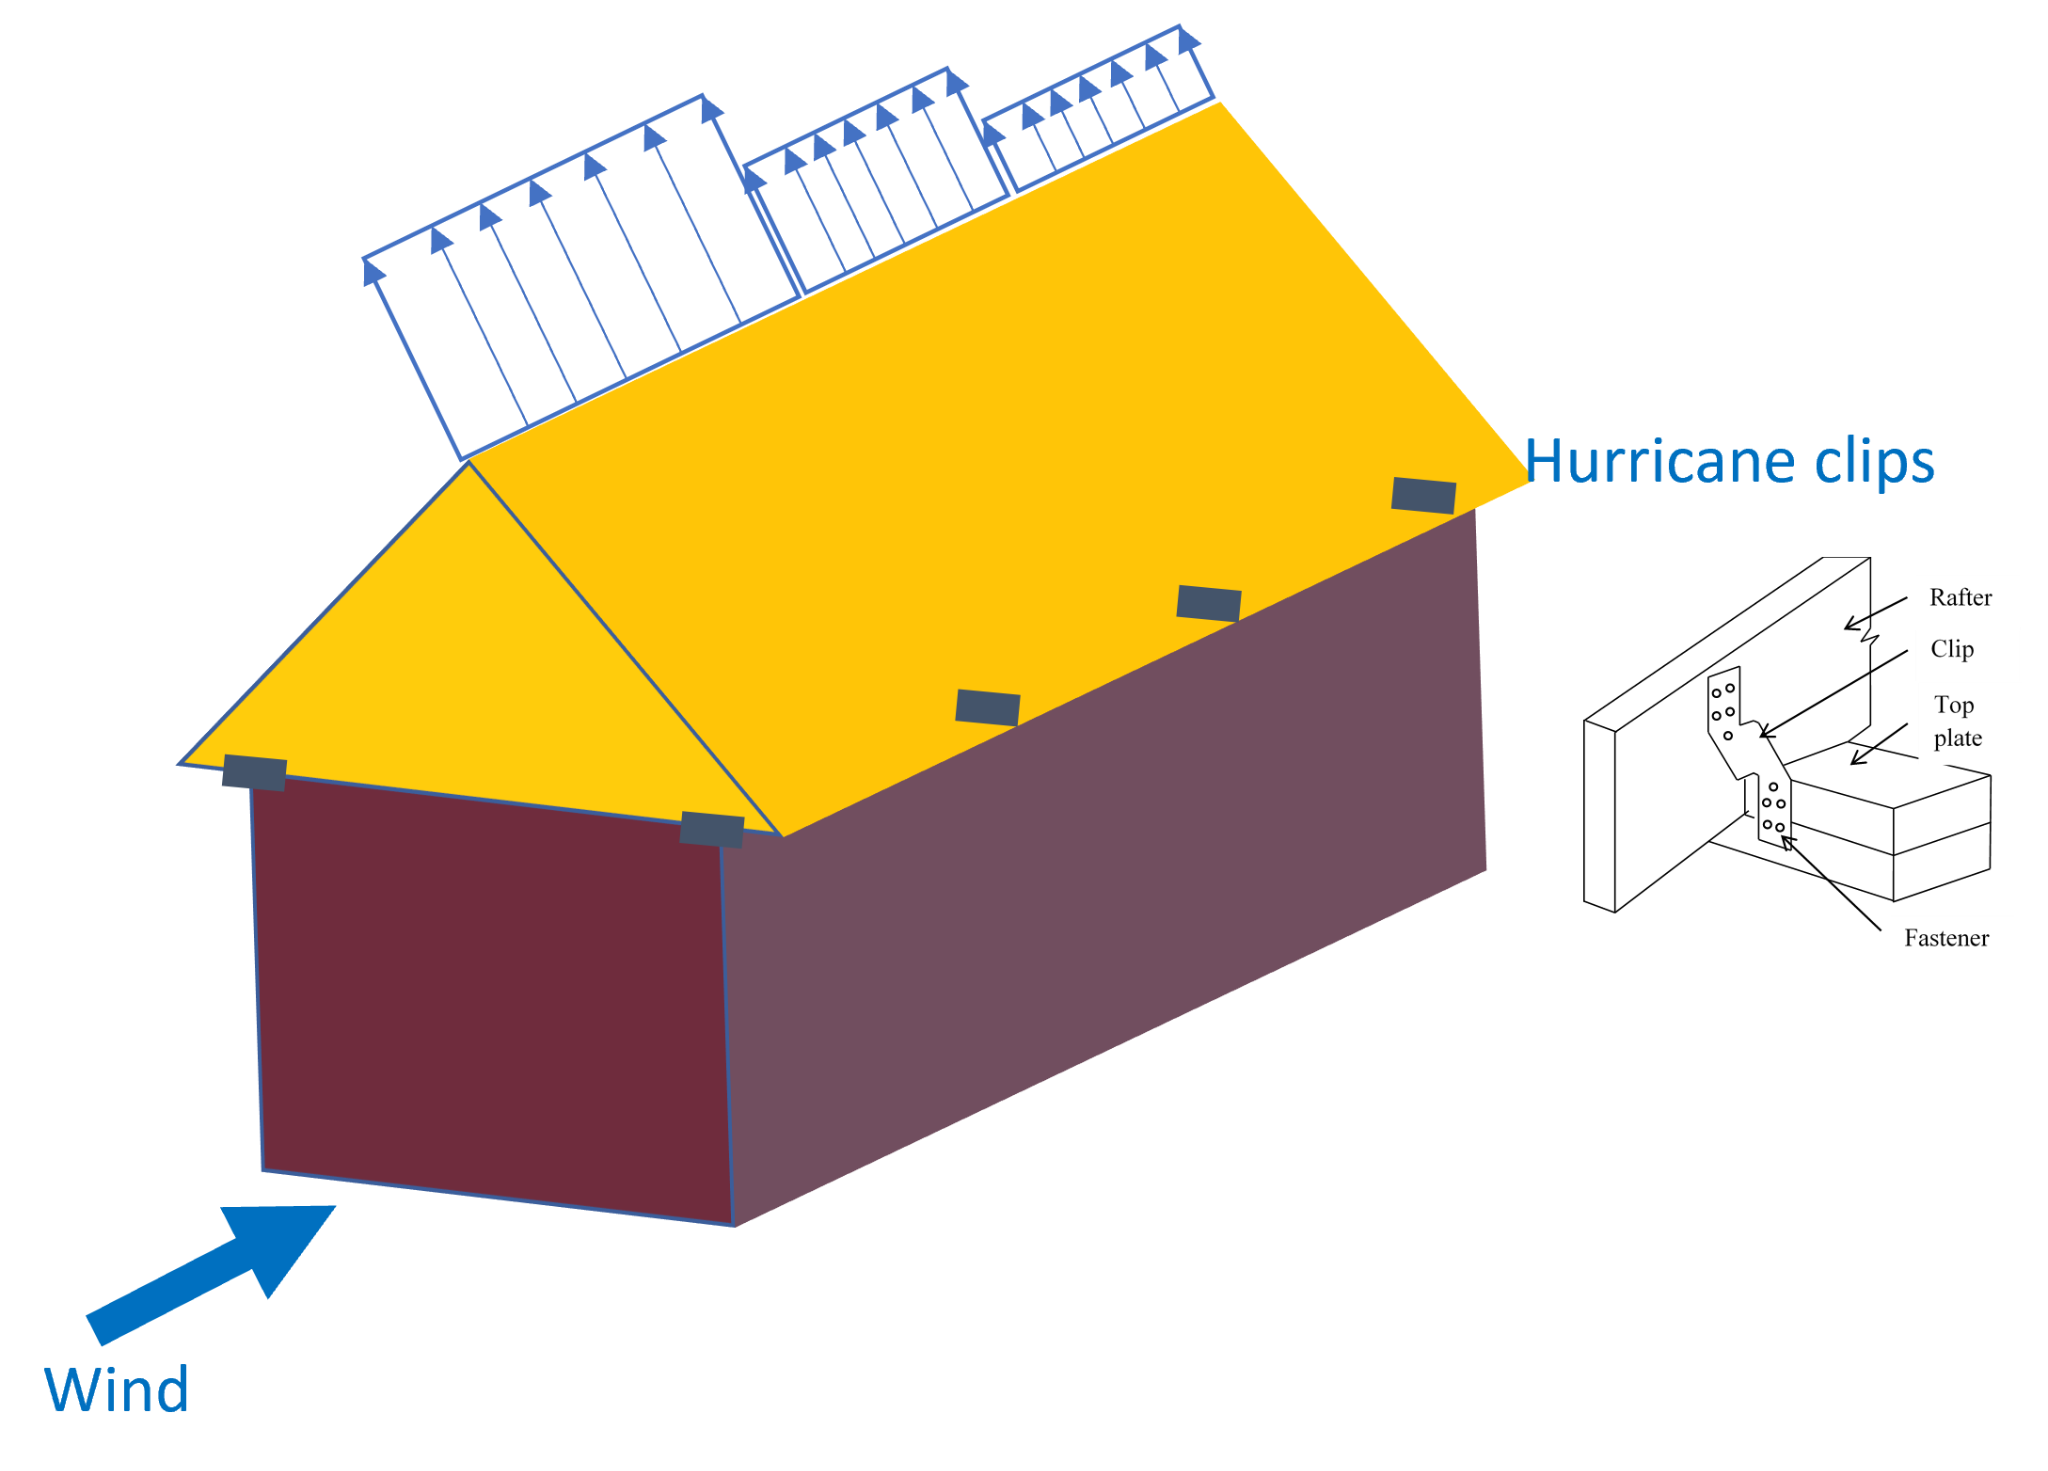
Residential roof subject to wind uplift
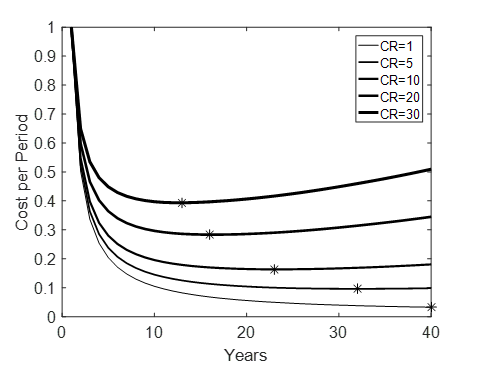
Optimal replacement ages for different component costs
Probabilistic methods to improve hurricane resilience of coastal structures
The insured value of properties continues to rise in the U.S., especially for coastal regions that are prone to hurricane hazards. However, due to the large uncertainties in building performance against hurricanes based solely on past loss data it is very difficult to perform an effective cost-benefit analysis.
This research studied a Bayesian model updating method for quantification of uncertainty in the analytical capacity predictions of roof-to-wall connections of wooden structures. The ultimate goals are to construct fragility models for various mitigation options accounting for uncertainties due to model discrepancy and experimental error and to determine the most cost-effective option under a potential hurricane in terms of aggregate loss estimates based on total probability of failure.
In an extension of the research, the fragility functions were used to develop time-dependent reliability models and construct optimal maintenance plans for residential buildings subject to hurricane winds by considering the capacity degradation of components over the lifetime due to aging.
Hurricane loss estimation in wood-frame buildings using Bayesian model updating
Preventive maintenance of wood-framed buildings for hurricane preparedness
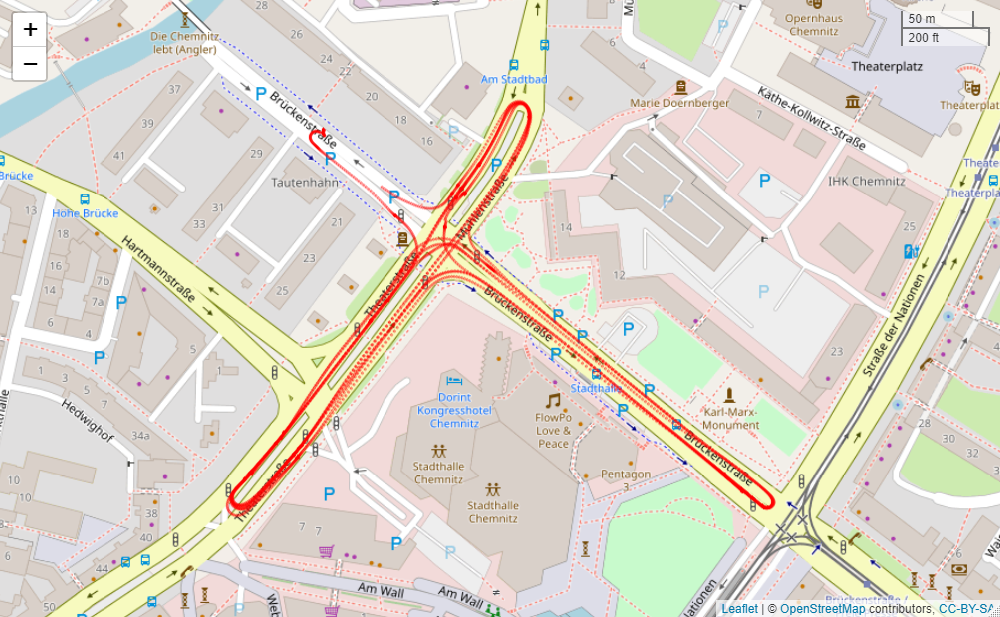
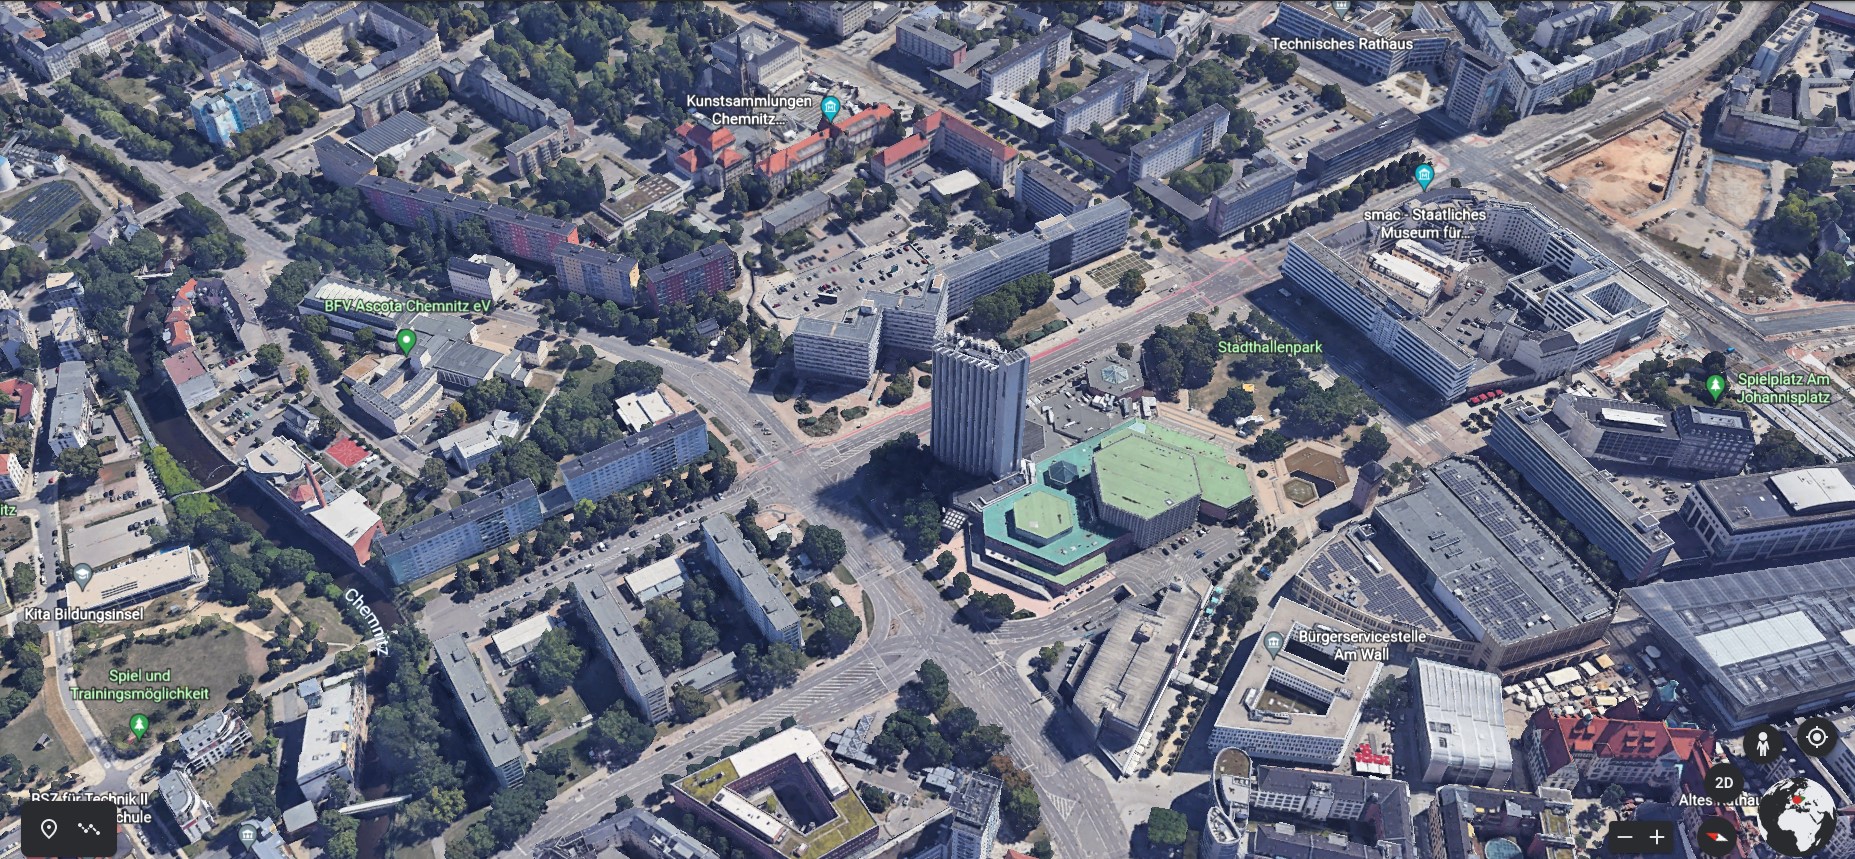
GPS instrumented vehicle data collection experiment in Chemnitz City, Germany. Ground truth data (Top). Tall buildings causing non-line-of-sight conditions (Bottom).
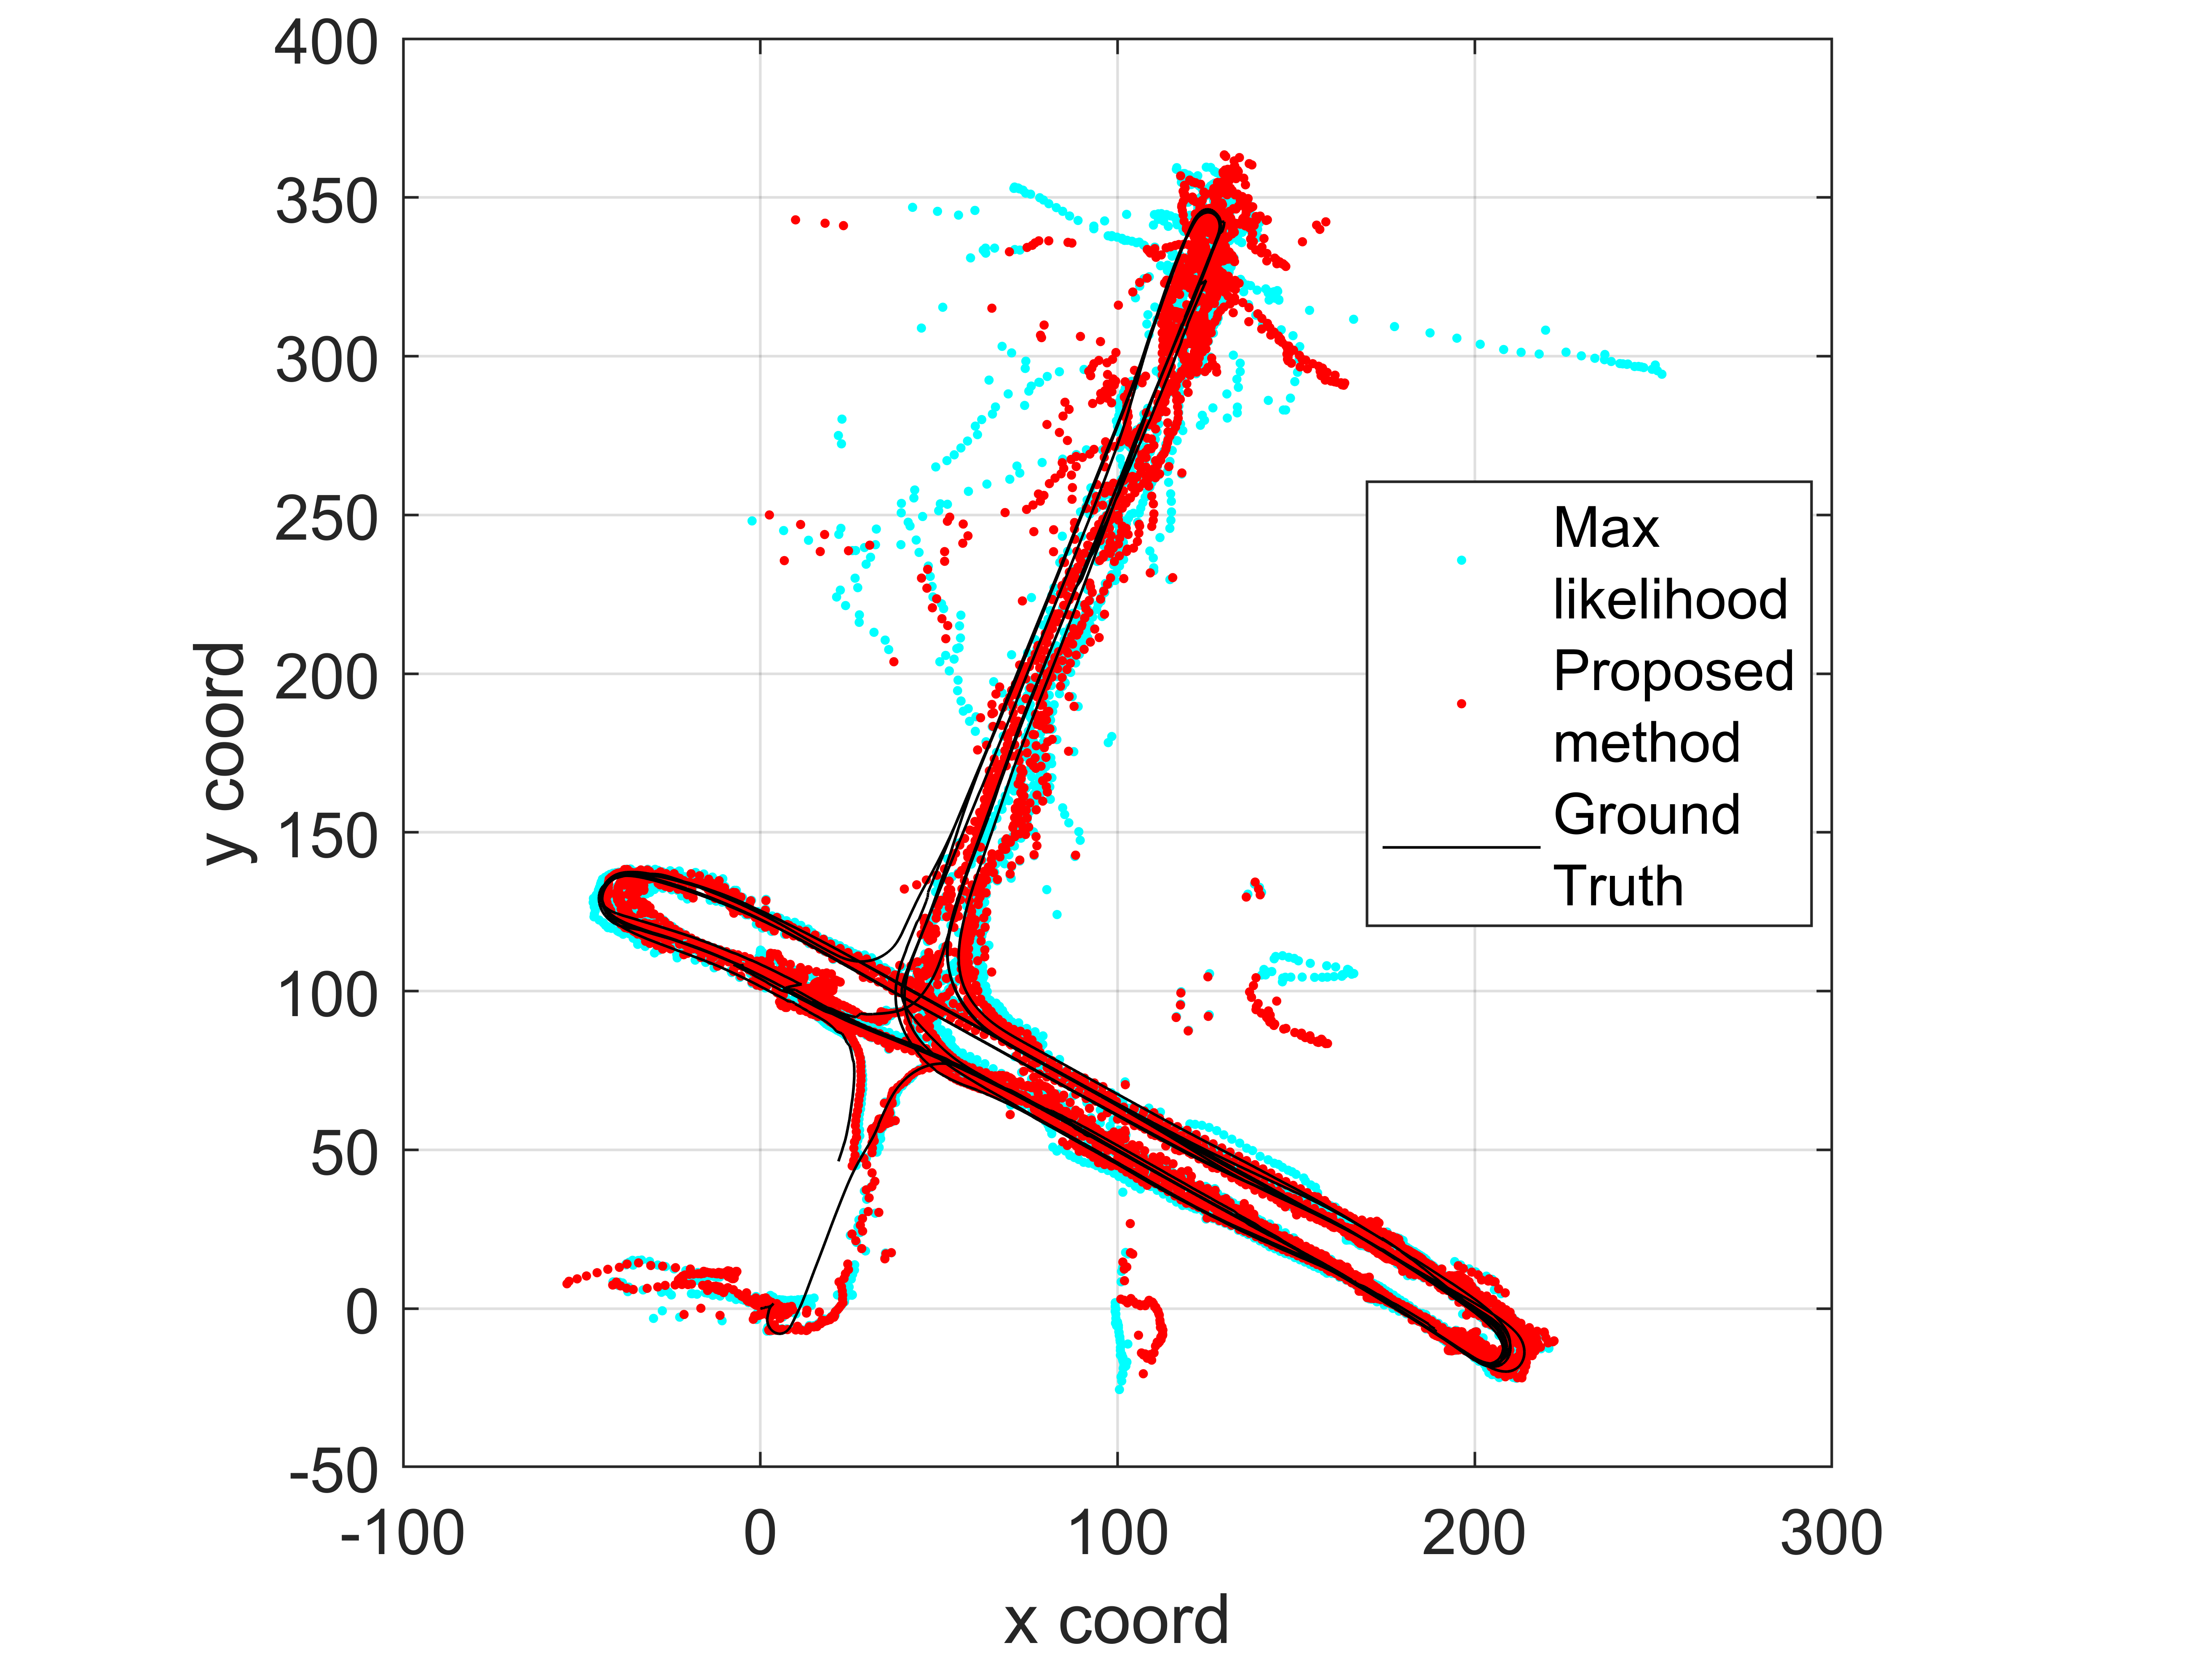
GPS based localization results with proposed robust M-estimation and the Maximum Likelihood Estimation
Robust localization in GPS based navigation
An important challenge in global positioning system (GPS) - based localization is the non-line-of-sight or multi-path problem, commonly encountered in urban environments. When the direct line-of-sight to a satellite is blocked by a building, its GPS signal may reach the receiver on the ground via reflections from buildings, resulting in large errors or outliers in the pseudorange measurements.
In this research, we propose new unbiased estimators of the noise covariances in a factor-graph formulation when sensor data is contaminated with outliers and Gaussianity of data is not satisfied, particularly applicable to the GPS-based localization problem under non-line-of-sight conditions. Main contributions are the extending of the unbiased variance estimators to the existing factor-graph problem in the literature to the multi-path problem, the study of nonlinear vehicle motion models, and the investigation of the performance of the approach with a real GPS data.
Robust error estimation based on factor-graph models for non-line-of-sight localization