Centrifugal Pump Experiment
Introduction
The Technovate Model 9010 Centrifugal Pump System will be used to study the performance characteristics of a typical Centrifugal pump.
Experimental Apparatus
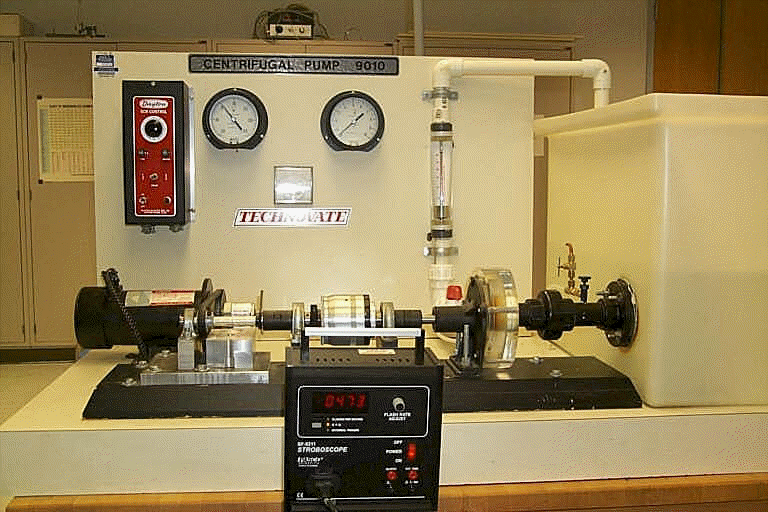
The Technovate Model 9010 Centrifugal Pump System will be used to study the performance characteristics of a typical Centrifugal pump. Figure 1.1 shows the Model 9010 in its entirety. This model is made up of many components. For a detailed view of these component and their function click on them in Figure 1.1.

Figure 1.1 Centrifugal Pump 9010.
Experimental Procedures
General Operation
The first step in operating the Technovate Model 9010 Centrifugal Pump System is to make sure the system is plugged in. Then make sure the flow control valve is opened half way never start pump with valve closed. Before turning the motor on make sure that the upstream pressure valve P_0 is closed along with the vent. Next set master speed control dial on the SCR Motor Controller to 0. With ON/OFF in the OFF position, set the FWD/BRAKE/REV switch to FWD position. Now turn the ON/OFF switch to ON and turn the master speed dial to the desired flow rate or the maximum flow rate of 30 GPM. With the motor turning the pump, now open the upstream pressure valve P_0. Adjust the flow control valve for the desired flow rate or discharge pressure at the pump outlet.
Experiment 1
Determine the relationship between pump pressure rise and flow rate for different speeds of rotation. Select several speeds at equal intervals over the range of the motor up to the full load RPM. For each speed vary the flow rate by adjusting the flow control valve. Note the flow rate and pressure gauge readings. Plot the data for each RPM and approximate it with a curve. Sample Graph
Experiment 2
Determine the relationship between pump pressure rise and flow rate for different horsepower values. Select several horsepower values. Adjust the motor speed and flow control valve to obtain a constant BHP value for the different flow control valve (flow rates) settings. Select BHP and RPM first, and calculate the corresponding torque. Set the pump speed and adjust the valve to obtain the corresponding torque. Plot the data for each BHP. Sample Graph

Experiment 3
Determine the constant efficiency curves. For either experiment 1 or 2 depending on the amount of data (the more the better), calculate the efficiency of the pump at each data point. Interpolate the data for each selected value of efficiency and plot constant efficiency curves. Sample Graph
![]()
Note for all experiments write down all the data values, this will be useful in other experiments.
Discussion
1. From the results obtained in the experiments, where is the most desirable operating point in terms of flow rate and pressure rise for this particular pump?
2. Explain the decline in performance when the pump is operated at operating points other than the optimum point.
3. Specific speed of the pump ![]() is one of the most important numbers in pump selection.
Select the optimum range of pump operation for this pump and calculate the
corresponding range for N_s. Compare it to typical values given in the references.
is one of the most important numbers in pump selection.
Select the optimum range of pump operation for this pump and calculate the
corresponding range for N_s. Compare it to typical values given in the references.