Results
Our team's accomplishment this year
Through the work put in for this session, our team was able to share the following results with our reviewers. The results not only proves that we are able to distinguish the reflection from to metal objects within our scene, but we can also show the angular difference between the reference metal and the second piece.
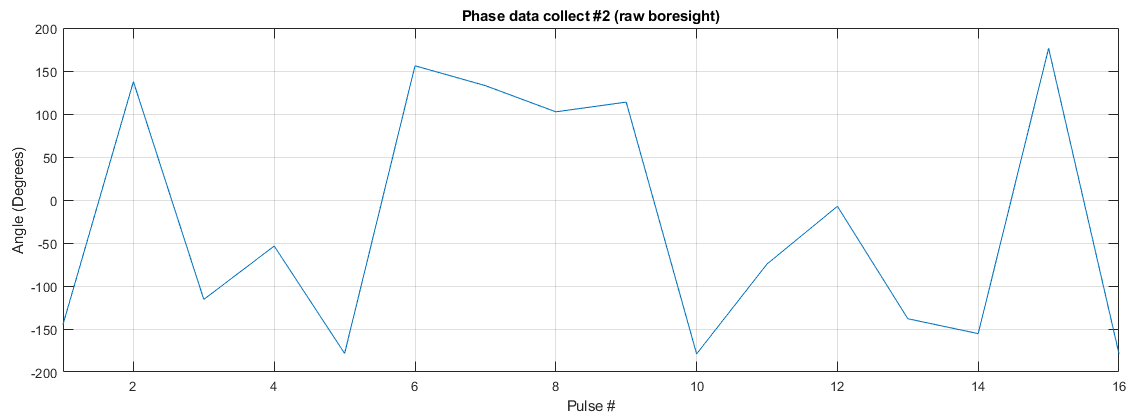
The above plot shows the phase angle at the receive horns for each reflection from the metal. It is essential to collect this portion of data before moving on to any other data analysis we have in our code. The "symmetric" shape formed across the pulses received shown above verifies that the FPGA and horns of the aperture are synchronized. Without this symmetry, any further results will be inaccurate due to misalignment on the aperture due to misalignment caused by poor synchronization.
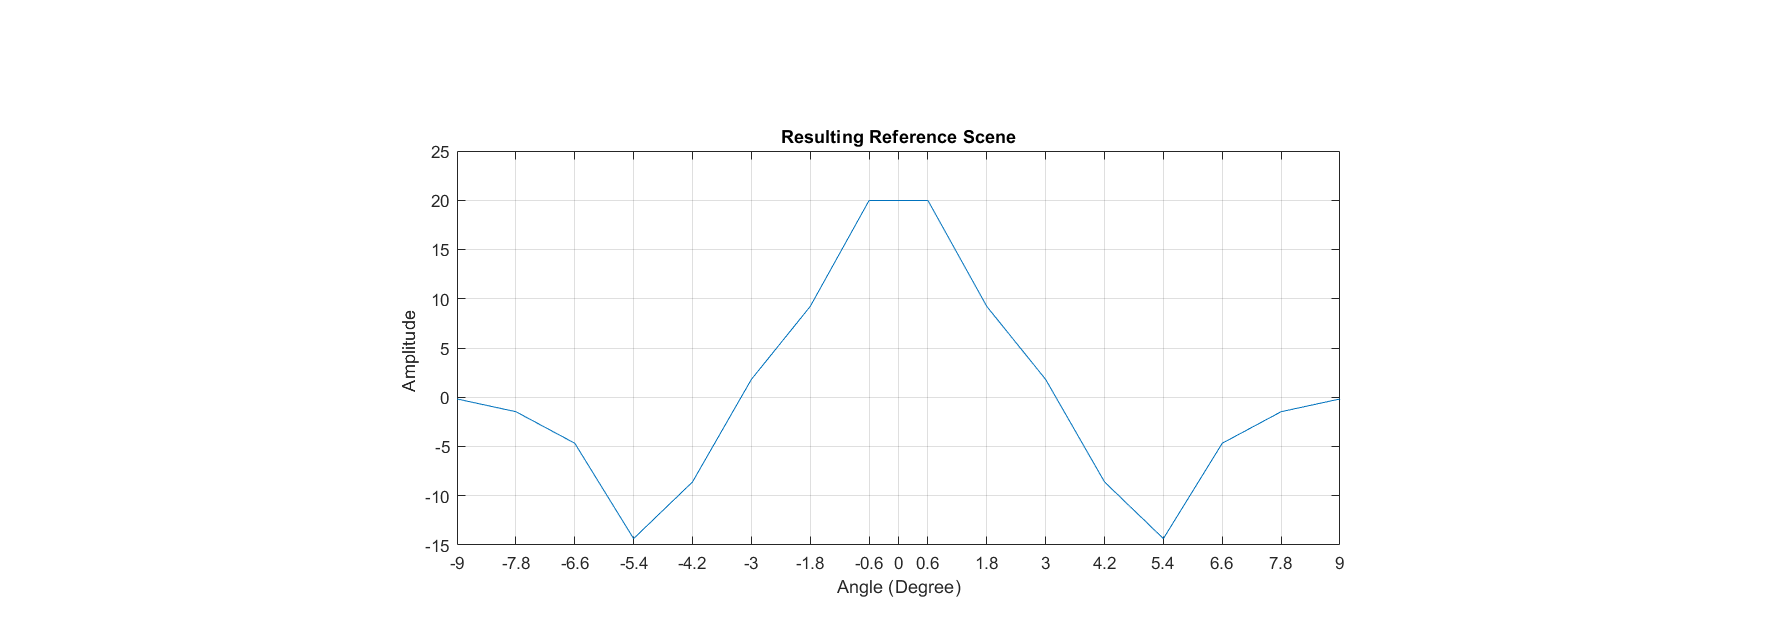
The image shown above is the energy received from the reference metal verus the angle of arrival. This is what the energy field looks like when all there is only one metal object directly centered in front of the aperture (Roughly 40ft away). The peak centered at '0' degrees on the graph shows that the metal is placed directly in front of the aperture.
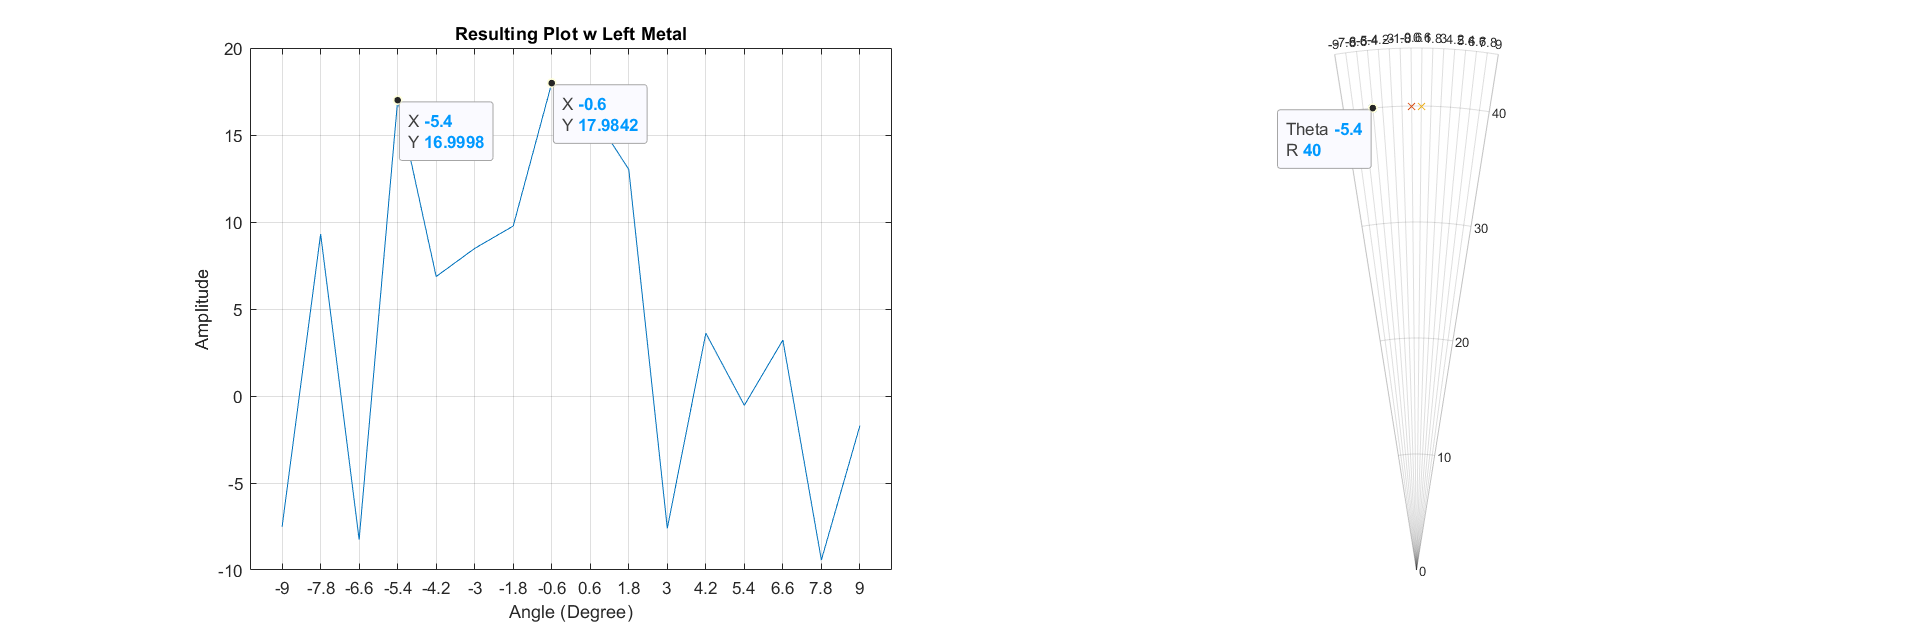
This is what the energy field looks like when we add a second metal object about 5ft to the left of the reference piece. The two peaks highest peaks in amplitude on the left graph tells us that there are two pieces of metal in the scene. The polar plot on the right shows at what angle the second piece of metal is located relative to the reference pieces.
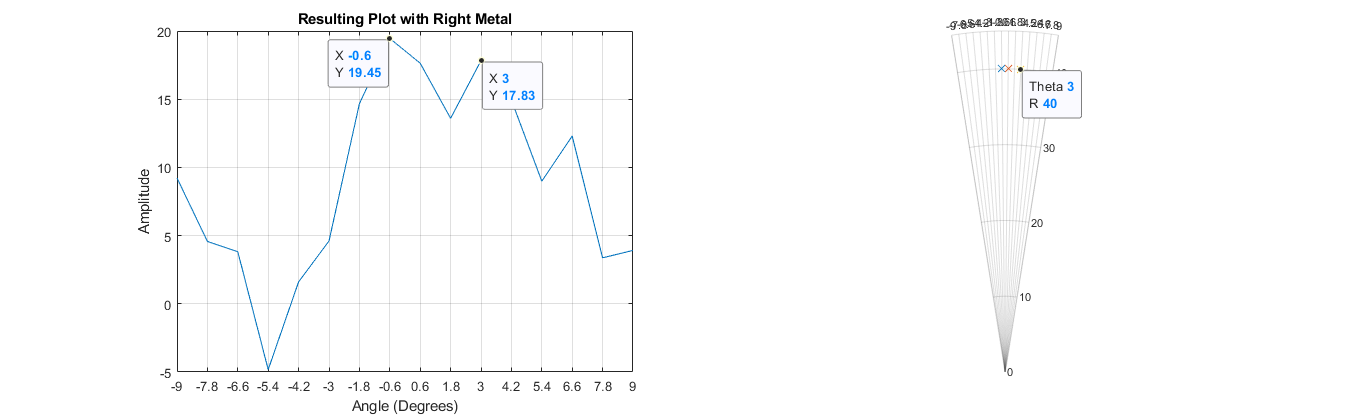
This is what the energy field looks like when we add a second metal object about 3ft to the right of the reference piece. As with the previous graphs, the two peaks of amplitude show the relative metal locations. The polar plot shows the angles where the metal is located.