Team 403 determined research questions to conduct the Minitab analysis. Questions 1-5 provided Univariate data summaries, questions 6-10 provided Bivariate data summaries, and question 11 provided Multivariate data summary. The research questions are as follows.
1. How are the total infusion chair minutes distributed?
2. Is there a trend of scheduled appointments by season?
3. Is there a correlation between multiple scheduled appointments and appointment type?
4. What types of appointments occur most frequently?
5. Are appointment types normally distributed?
6. What appointment type group causes the most inconsistencies in scheduling?
7. Which defects, or over/under scheduled appointment time by 30-minute intervals, are the most prominent?
8. Which appointment type groups cause the appointment to not be on schedule?
9. During which hours of operation is the utilization highest and lowest?
10. Is the appointment workload evenly distributed among physicians with similar appointment types?
11. What is the average time of appointment type compared to the appointment type groups?
Examples of Minitab graphs are shown in this section. The pie chart, Figure 4, examines the breakdown of appointment type of the appointments that are internal providers. More than half of the appointments from the 2019 data set are chemotherapy. Since chemotherapy appointments are the majority of appointment types from the 2019 data set the team shifted their focus to chemotherapy processes and appointments only.
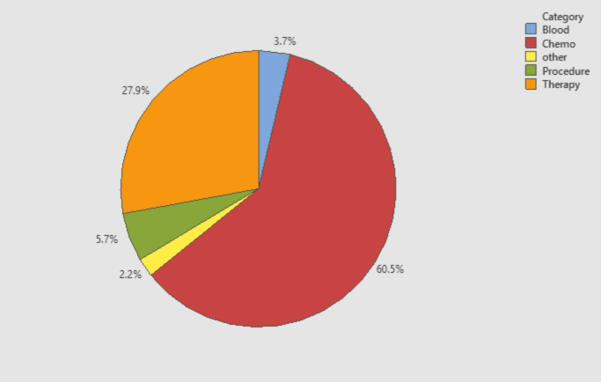
Figure 4: Appointment Type Group for Internal Providers
The pareto chart inf Figure 5 shows the total annual chair utilization minutes during the hours of operation. The cumulative distribution shows that 80% of the total infusion chair minutes happen between 8 AM and 11 AM. The team determined that the majority of on-site observations should occur during this time frame in order to see congestion and potential bottlenecking.
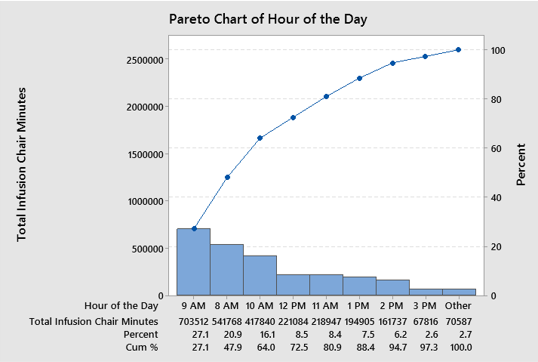
Figure 5: A Pareto Chart of Hourly Intervals vs Total Infusion Chair Minutes
For a general understanding of utilization, a histogram was used to show the distribution of the appointment utilization. This was calculated by dividing the total infusion chair minutes by the scheduled appointment times. Figure 6 shows that a high frequency of appointments had an appointment utilization around 1, which was ideal because it means the average appointment utilization was not significantly high or significantly low. The spread shows a very slight right skew, so appointments were under the allotted time more often than over the allotted time.
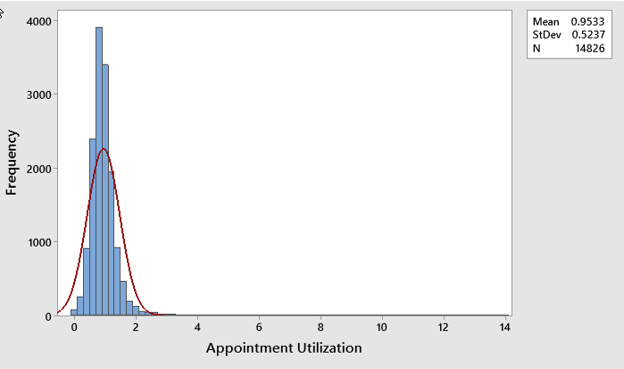
Figure 6: Histogram of Appointment Utilization